Keywords
Drosophila, orthology, orthologues, comparative genomics, database, orthologous groups, gene families, synteny
This article is included in the Bioinformatics gateway.
This article is included in the Genomics and Genetics gateway.
This article is included in the The OMA collection collection.
Drosophila, orthology, orthologues, comparative genomics, database, orthologous groups, gene families, synteny
The fruit fly, Drosophila melanogaster, is one of the most comprehensively studied model organisms, supported by decades of research, with advanced genetic tools and genomic resources, and a wealth of accumulated knowledge (Adams et al. 2000; Markow 2015). It is therefore a key source of gene functional information that can be tentatively propagated to other species through an evolutionarily-informed framework. Reciprocally, cross-species genomic comparisons help to delineate gene evolutionary histories and thereby further inform D. melanogaster biology by characterising gene and gene family origins, trajectories, and dynamics. This is evident from early cross-phyla perspectives (Rubin et al. 2000; Venter et al. 2001) and over shorter evolutionary timescales such as across the Drosophila genus (Drosophila 12 Genomes Consortium 2007; Hahn et al. 2007; Heger and Ponting 2007). Continued sequencing efforts e.g. (Kim et al. 2021; Suvorov et al. 2022) mean that genome assemblies are now available for some 150 Drosophila species, providing unprecedented resolution for employing comparative approaches to study gene and genome evolution across the genus.
Cross-species comparisons to characterise gene evolutionary histories provide a foundation from which to trace speciation, duplication, and loss events leading to the gene repertoires encoded in each species’ genome (Koonin 2005). Arising respectively through speciation and duplication events, orthologues and paralogues together form orthologous groups comprising all genes descended from a single gene in the last common ancestor of the set of species under consideration (Nevers et al. 2020). Numerous methods, broadly categorised as tree-based or graph-based approaches, have been developed to delineate orthologous groups (Altenhoff and Dessimoz 2012), with ongoing efforts to improve quality and scalability of orthology resources (Linard et al. 2021; Nevers et al. 2022). Such resources provide the basis for building evolutionarily-informed hypotheses on gene function, or the so-called transfer of functional annotations. This relies on the baseline assumption of functional equivalency amongst genes that share a common ancestor, which although not without its caveats (Robinson-Rechavi 2020), remains the primary means of large-scale functional annotations.
As the primary database for researchers using D. melanogaster as a model organism, FlyBase provides access to a wide range of information including genetic, genomic, molecular, and reagent resources (Larkin et al. 2021; Gramates et al. 2022). For cross-species gene repertoire comparisons, FlyBase employs the Drosophila RNAi Screening Center Integrative Ortholog Prediction Tool (DIOPT) (Hu et al. 2011), which integrates orthologue predictions for human and eight model organisms obtained from a range of popular orthology delineation tools. For comparisons beyond the core model species, FlyBase displays orthology predictions for other Drosophila species as well as for other selected arthropods sourced from the OrthoDB catalogue of orthologues (Zdobnov et al. 2021). Other publicly available orthology resources containing predictions across multiple drosophilids and hundreds to thousands of other species include eggNOG v5.0 (Huerta-Cepas et al. 2019), OrthoInspector (Nevers et al. 2019), Ensembl Genomes (Yates et al. 2022), and the OMA Orthologous Matrix browser (Altenhoff et al. 2021). Most other online orthology resources emphasise taxonomic breadth over depth of sampling within a given lineage, and therefore usually only D. melanogaster is represented.
To take advantage of the growing number of available genome assemblies for Drosophila species, and to address the lack of orthology resources supporting genus-spanning multi-species comparative analyses to study fruit fly gene and genome evolution, we developed DrosOMA - the Drosophila Orthologous Matrix browser. DrosOMA uses the OMA (Altenhoff et al. 2021) methodology to delineate orthology and paralogy for 36 drosophilids and four outgroup dipterans with high quality genome assemblies and annotations. The results are browsable in a feature-rich web interface, with gene-, orthologous group-, and genome-centric pages, as well as protein domain architecture and local and global genomic synteny visualisations, extensive gene name and identifier cross-references, and available functional annotations. This demonstrates the deployability of the OMA browser framework for building taxon-targeted orthology databases, here at the genus level, and provides a tailored resource for the Drosophila research community.
Drosophila species with high quality and complete assembled and annotated genomes were selected for inclusion in DrosOMA so as to sample broadly across the genus. Of more than 350 assemblies representing some 140 species at the United States National Center for Biotechnology Information (NCBI), genome annotations were available for 49 species (Sayers et al. 2023). Protein-coding gene annotations for D. melanogaster were sourced from FlyBase (Gramates et al. 2022). All of the source data are available publicly - the accession numbers and version numbers are all given in Table 1. Assessments of completeness performed using Benchmarking Universal Single-Copy Orthologues (BUSCO) (R.M. Waterhouse et al. 2018; Manni et al. 2021) v5.4.0 and sourced from the A3Cat Arthropoda Assembly Assessment Catalogue (Feron and Waterhouse 2022) were used to select only annotated assemblies with Diptera-level BUSCO completeness scores of more than 95%. Filtering to reduce sampling of closely related species resulted in a final set of 36 Drosophila species with high-quality annotated assemblies for orthology delineation, as well as four outgroup mosquito species (Table 1).
Annotations were sourced from the NCBI, apart from D. melanogaster annotations which were sourced from FlyBase. Only one isoform per gene is used as input for OMA.
All annotated protein-coding genes from the 40 selected species were used as input for delineating orthologous groups for DrosOMA. Briefly, orthology delineation using the OMA Standalone inference algorithm consists of three main stages (Altenhoff et al. 2019, 2021). Firstly, all-against-all Smith-Waterman sequence alignments are computed using the SWPS3 vectorized implementation of the Smith-Waterman local alignment algorithm and significant matches are retained to define homologous proteins (i.e. sequences with a common ancestry). Before inferring orthology, one representative protein per gene is selected. OMA Standalone uses all isoforms for the first all-against-all alignment stage and selects as the reference protein the isoform with the best matches across all species (this can be considered as the most evolutionarily conserved isoform). Secondly, mutually closest homologues between species pairs are identified based on evolutionary distances to infer orthologous pairs (i.e. homologues related through speciation), while accounting for distance inference uncertainties and for potential differential gene losses. Finally, all identified orthologous pairs are clustered using two different approaches to produce catalogues of OMA Groups and Hierarchical Orthologous Groups (HOGs) (Zahn-Zabal et al. 2020). HOGs are defined as sets of genes that descended from a single ancestral gene at a given taxonomic range. These sets correspond to the idea of subfamilies for a given taxonomic range and can contain more than one gene from a species, i.e. inparalogues. OMA Groups on the other hand are sets of orthologues where each gene is orthologous to one another. The history of such sets should correspond to the species phylogeny and hence they are especially useful as markers to reconstruct the species phylogeny. For this dataset the production pipeline of OMA was employed, but the same clustering can also be performed using OMA standalone. In order to build the browsable DrosOMA instance, the OMA orthologues were converted using the oma2hdf command from the pyoma python package into an HDF5 database. CATH domain annotations (Sillitoe et al. 2021) were computed using the cath-tools v0.16.10 package and with the provided hmm models from CATH release 4.2. Protein cross-references were added by matching the sequences against the full UniProtKB and RefSeq databases, requiring exact matches.
The OMA browser instance for DrosOMA was set up and is hosted on a virtual machine using docker containers. The virtual machine requires relatively modest resources, i.e. 2 CPUs clocked at 2.25 GHz each, 8 GB RAM and 25 GB storage. The docker images for the OMA Browser were created from the pyomabrowser repository (https://github.com/DessimozLab/pyomabrowser) following the steps described in https://zoo.cs.ucl.ac.uk/doc/pyomabrowser/setup.html. Before building the docker images, the following aspects of the OMA Browser web interface were adjusted in order to make it a Drosophila-specific instance: We removed all the instances of non-drosophila proteins in the search examples by adjusting the Django templates in oma/templates, oma/test/ and oma_rest/. Similarly, we changed the OMA logo by replacing the corresponding file in/oma/static/image. These customisations are mostly cosmetic changes that will make the service more user friendly, and are not strictly needed for website functionality. Finally, paths, deployment type, and rabbitmq/celery credentials were adjusted and hosts were allowed in for_docker/env.
The species tree was computed using single-copy orthologues identified during the BUSCO completeness assessments of the genomes of the species selected for inclusion in DrosOMA. The protein sequences of BUSCO genes found in at least 38 of the 40 species were aligned using MUSCLE 3.8.1551 (Edgar 2004) with default settings and subsequently trimmed to retain well-aligned regions using TrimAl (Capella-Gutiérrez et al. 2009) with the “-strictplus” option. The 2,891 alignments were merged to build a 40-species concatenated superalignment (1,581,953 columns; 683,285 distinct patterns; 658,691 parsimony-informative; 180,333 singleton sites; 742,929 constant sites) used as input for phylogeny reconstruction using IQ-TREE 2.2.0-beta (Nguyen et al. 2015) with 1,000 bootstrap samples (options: -msub nuclear -B 1000 -bnni). The molecular species phylogeny was time-calibrated by providing calibration dates for the Diptera root, Culicidae, Drosophilini, willistoni-melanogaster ancestor, and navojoa-albomicans ancestor, from the TimeTree database (Kumar et al. 2022) to the functions makeChronosCalib() and chronos(), from the ape R package (Paradis and Schliep 2019), and plotted using the ggtree R package (Yu 2023).
The DrosOMA Drosophila Orthologous Matrix browser implements for users a feature-rich web interface to explore the results of orthology inference amongst complete genomes. The service is implemented with the django framework, a high-level Python web framework that encourages rapid development and clean, pragmatic design.
The DrosOMA Drosophila Orthologous Matrix browser operates on standard up-to-date web browsers including Google Chrome, Mozilla Firefox, and Apple Safari. The operational setup of an OMA browser instance such as DrosOMA requires a host that runs docker containers orchestrated with docker compose.
Applying OMA orthology delineation to the protein-coding genes from 36 drosophilids and four outgroup mosquito species (see Methods) resulted in the clustering of 93.5% of proteins in OMA Groups and 95.6% in Hierarchical Orthologous Groups (HOGs), with almost 25,000 HOGs at the last common ancestor of all DrosOMA species (Table 2). The OMA Groups are cliques of orthologues based on the orthology graph, meaning that all the components (proteins) of an OMA Group are connected to each other through pairwise orthologous relationships. Although all members of the OMA Groups are orthologous to all other members of the same group, OMA group members are not necessarily 1-to-1 orthologues. The OMA HOGs comprise sets of proteins encoded by genes descended from a common ancestral gene in the last common ancestor of a set of species (i.e. at a specific taxonomic level in the species phylogeny). The “hierarchical” nature of HOGs is due to their being defined with respect to specific clades within the species tree, so HOGs are nested subfamilies with groups delineated for younger radiations being encompassed within larger HOGs defined at older nodes. DrosOMA contains HOGs delineated at the root, three mosquito nodes, and 13 drosophilid nodes including Sophophora, the melanogaster group, and the melanogaster subgroup.
The fully-resolved time-calibrated species phylogeny (see Methods) defines the relationships amongst the 36 Drosophila species and the outgroup mosquitoes over approximately 260 million years of evolution (Figure 1). Analysis of the root-level HOGs shows counts of proteins per species belonging to universal single-copy HOGs (9.8% of HOGs; 17.1% of proteins), universal but variable-copy-number HOGs (19.6% of proteins), non-universal HOGs with outgroup species orthologues (13.7% of proteins), as well as drosophilid-specific HOGs with orthologues from all (16.8% of proteins), the majority (17.9% of proteins), or the minority (7.7% of proteins) of the 36 Drosophila species. This leaves an average of 527±392 proteins per drosophilid species with no identifiable orthologues, i.e. annotated protein-coding genes that, given the set of species under consideration, appear to be species-specific with no traceable common ancestry.

The time-calibrated species phylogeny (left) shows the estimated evolutionary relationships amongst the set of 40 species spanning approximately 60 million years since the last common ancestor of the Drosophila genus. The dashed line indicates the Drosophila and Culicidae last common ancestor but for visualisation is not placed according to the timescale. The barchart (right) shows counts of genes per species categorised according to their orthology type based on root-level hierarchical orthologous groups (HOGs). Analysis of the root-level HOGs shows counts of proteins per species belonging to universal single-copy HOGs (Single-copy All), universal but variable-copy-number HOGs (Orthologues All), non-universal HOGs with outgroup species orthologues (Drosophila & Culicidae), mosquito-only orthologues (Culicidae Only), as well as drosophilid-specific HOGs with orthologues from all (Drosophila All), the majority (Drosophila Majority), or the minority (Drosophila Minority) of the 36 Drosophila species. This leaves an average of 527 ±392 proteins per drosophilid species with no identifiable orthologues, i.e. annotated protein-coding genes that, given the set of species under consideration, appear to be species-specific with no traceable common ancestry. Branch lengths are shown in millions of years; all nodes received 100% bootstrap support except * with 95%; D. Drosophila; An. Anopheles; Ae. Aedes; Minority <18 drosophilids; Majority ≥18 drosophilids.
As DrosOMA uses the same database and interface design and architecture as the OMA browser (Altenhoff et al. 2021), an extensive array of data querying and visualisation options are available to the user. Searches may be performed using gene or protein names, descriptors, or identifiers, or protein sequences, and extensive cross-referencing to public databases allows for searches using identifiers from resources such as UniProt (The UniProt Consortium et al. 2023), RefSeq (O’Leary et al. 2016), EntrezGene (Sayers et al. 2023), Swiss Model (A. Waterhouse et al. 2018), STRING (Szklarczyk et al. 2023), and Bgee (Bastian et al. 2021), in addition to the source FlyBase and NCBI identifiers and annotations (Figure 2A). Search result visualisations are focused on the three main data types, i.e. with views for genomes, groups (Figure 2B), or genes (Figure 2C). Genome-view pages summarise available information per species, e.g. a list of all their genes and of their most closely related species, as well as tools for building pairwise global synteny visualisations. Group-view pages display information about OMA Groups or HOGs, showing filterable lists of member genes with their associated cross-referenced identifiers and cartoon views of protein domain architectures, as well as visualisations of HOG members guided by the species phylogeny. Gene-view pages display information associated with a gene and its protein products, including sequences (protein and cDNA), cross references to other public databases, and available functional annotations in the form of Gene Ontology terms (The Gene Ontology Consortium et al. 2021).
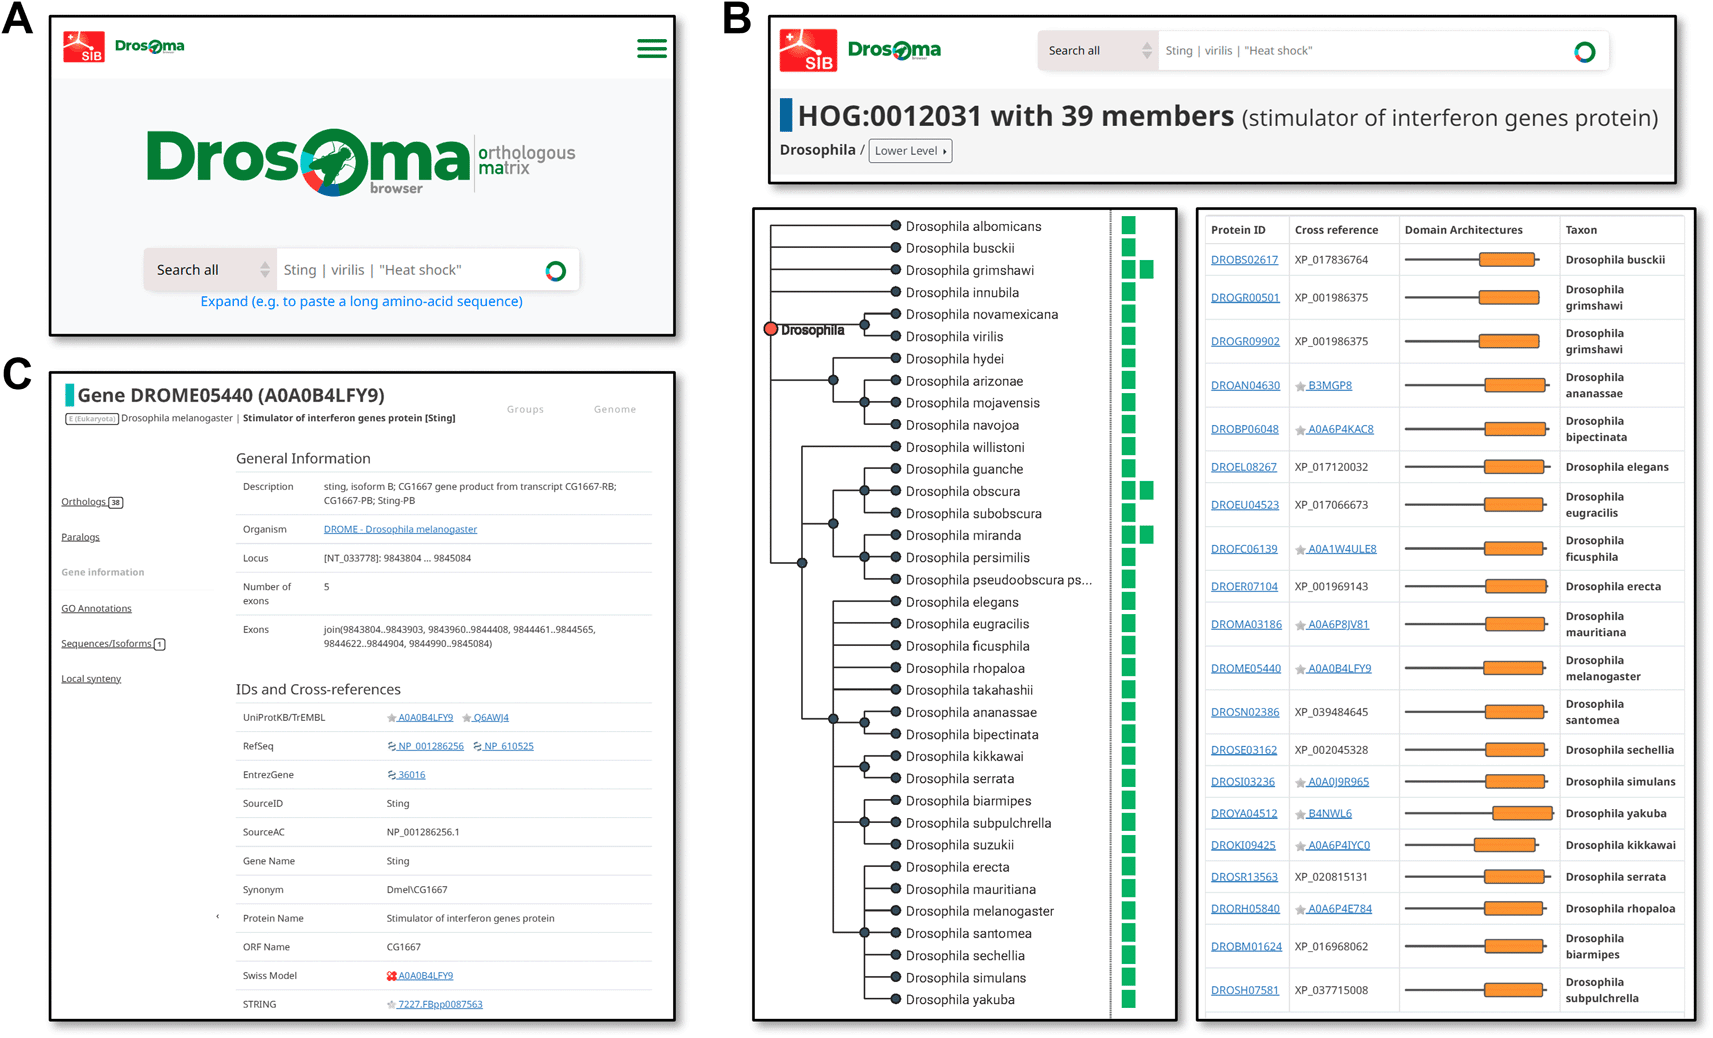
(A) The simple search entry point for DrosOMA allows for text searches with gene names, descriptors, or identifiers, as well as with protein sequences. (B) Visualising information for Hierarchical Orthologous Groups (HOGs) can be guided by the species phylogeny (left) showing counts of orthologues per species, or as a table (right) with protein identifiers and cartoons showing domain architectures. (C) The gene view page displays available information for genes of interest and their mappings to external databases.
Other useful search, visualisation, and download features are described in the DrosOMA “Explore”, “Tools”, “Download”, and “Help” pages, with several examples and explanations for the general use of the OMA browser elaborated in a dedicated primer (Zahn-Zabal et al. 2020). Examples of these extended features include sequence alignment tools (Figure 3A) and local synteny visualisations (Figure 3B). For both OMA Groups and HOGs, the browser can generate multiple sequence alignments of the member proteins that can further be sorted, filtered, edited, and exported by users, for example, to use as inputs for building gene trees for orthologous groups of interest. Synteny, or how orthologues have maintained or shuffled their genomic arrangements throughout evolution, can be visualised at a local level (e.g. from a context of 9 to 19 orthologues) or at global level (along entire chromosomes for pairs of species), both based on comparing the relative genomic positions of orthologues across the species under consideration.

(A) Multiple sequence alignments of proteins from hierarchical orthologous groups (HOGs) or OMA Groups can be generated, visualised, explored, and downloaded using the DrosOMA Browser. (B) Local gene synteny conservation can be visualised to explore how orthologues have maintained or shuffled their local arrangements in the genomes of each considered species.
The rapidly growing number of species with sequenced and annotated genomes mean that publicly accessible resources offering results from large-scale comparative analyses such as orthology delineation often prioritise taxonomic breadth over depth when selecting which species to include. This means that despite increasingly comprehensive species sampling within some taxonomic groups, the available genomic data can remain under-exploited as only representative species are included in most taxonomically broad resources. The DrosOMA browser provides a resource aimed at the Drosophila research community that exploits the available high-quality genome annotation data across the genus. The successful deployment of DrosOMA illustrates the feasibility and utility of the OMA browser framework to be applied to other taxonomic groups with rapidly growing numbers of species with genomic data. Future studies taking advantage of increased taxonomic depth of sampling within a given genus, such as previous genus-wide investigations of Anopheles mosquitoes (Neafsey et al. 2015) or Bombus bumblebees (Sun et al. 2021), could therefore benefit from applying the framework to not only obtain orthology data, but to simultaneously build and deploy an interactive browser to further support their research. Yet-to-be annotated genome assemblies are publicly available for almost 100 more drosophilids, and data generation for additional species is ongoing. As more high-quality annotations for high-quality genomes become publicly available, future DrosOMA releases are set to further deepen taxonomic representation within the genus containing the arguably best studied representative of all animals.
| Views | Downloads | |
|---|---|---|
| F1000Research | - | - |
|
PubMed Central
Data from PMC are received and updated monthly.
|
- | - |
Provide sufficient details of any financial or non-financial competing interests to enable users to assess whether your comments might lead a reasonable person to question your impartiality. Consider the following examples, but note that this is not an exhaustive list:
Sign up for content alerts and receive a weekly or monthly email with all newly published articles
Already registered? Sign in
The email address should be the one you originally registered with F1000.
You registered with F1000 via Google, so we cannot reset your password.
To sign in, please click here.
If you still need help with your Google account password, please click here.
You registered with F1000 via Facebook, so we cannot reset your password.
To sign in, please click here.
If you still need help with your Facebook account password, please click here.
If your email address is registered with us, we will email you instructions to reset your password.
If you think you should have received this email but it has not arrived, please check your spam filters and/or contact for further assistance.
Comments on this article Comments (0)