Keywords
Anastasis, apoptosis, Cell Death, Cell Survival, Gene Expression, Recovery, Repair, Reversal of Apoptosis
Anastasis, apoptosis, Cell Death, Cell Survival, Gene Expression, Recovery, Repair, Reversal of Apoptosis
In the revised manuscript, we have added new data that support our conclusions. Specifically, our RT-PCR reveals that a human liver cancer cell line displays similar gene expression profile during anastasis as observed in mouse primary liver cells. Additional microarray statistical analysis is included as supplementary data. We have also discussed the potential molecular mechanisms, physiological and pathological consequences, and therapeutic potentials of anastasis.
See the authors' detailed response to the review by Takafumi Miyamoto
Apoptosis (Greek for “falling to death”) is essential for normal development and homeostasis of multicellular organisms by eliminating unwanted, injured, or dangerous cells1–3. This cell suicide process was generally assumed to be irreversible because it involves rapid and massive cell destruction4–9. During apoptosis, intrinsic and extrinsic pro-apoptotic signals can converge at mitochondria, leading to mitochondrial outer membrane permeabilization (MOMP), which releases cell execution factors, such as cytochrome c to trigger activation of apoptotic proteases including caspase-3 and -710,11, small mitochondria-derived activator of caspases (Smac)/direct IAP binding protein with low pI (DIABLO) to eliminate inhibitor of apoptosis protein (IAP) which suppresses caspase activation12,13, and apoptosis-inducing factor (AIF) and endonuclease G to destroy DNA14–17. Activated caspases commit cells to destruction by cleaving hundreds of functional and structural cellular substrates4,18. Crosstalk between signalling pathways amplifies the caspase cascade to mediate cell demolition via nucleases (DNA fragmentation factor [DFF]/caspase-activated DNase [CAD]) to further destroy the genome19–21, and alter lipid modifying enzymes to cause membrane blebbing and apoptotic body formation22,23. Therefore, cell death is considered to occur after caspase activation within a few minutes24–26.
However, we and other groups have demonstrated reversal of early stage apoptosis, such as externalization of phosphatidylserine (PS) in cultured primary cells and cancer cell lines27–30. We have further demonstrated that dying cells can reverse apoptosis even after reaching the generally assumed “point of no return”29–31, such as MOMP-mediated cytochrome c release, caspase-3 activation, DNA damage, nuclear fragmentation, and apoptotic body formation4–9. Our observation of apoptosis reversal at late stages is further supported by an independent study, which shows recovery of cells after MOMP32. To detect reversal of apoptosis in live animals, we have further developed a new in vivo caspase biosensor, designated “CaspaseTracker”33, to identify and track somatic, germ and stem cells that recover after transient cell death inductions, and also potentially during normal development and homeostasis in Drosophila melanogaster after caspase activation33,34, the hallmark of apoptosis4,35. We proposed the term “anastasis”30, which means “rising to life” in Greek, to describe this recovery from the brink of cell death. Anastasis appears to be an intrinsic cell survival phenomenon, as removal of cell death stimuli is sufficient to allow dying cells to recover29–31,33.
The physiological, pathological and therapeutic importance of anastasis is not yet known. We proposed that anastasis could be an unexpected tactic that cancer cells use to escape cancer therapy29–31. Many tumours undergo dramatic initial responses to cell death-inducing radiation or chemotherapy36–39; however, these cells relapse, and metastasis often occurs in most types of cancer36–39. Therefore, the ability of cells to recover from transient induction of cell death may allow tumour cells to escape treatment, and survive and proliferate, resulting in relapse29–31. Furthermore, cells may acquire new oncogenic mutations and transformation phenotypes during anastasis30,31, such as DNA damage caused by apoptotic nucleases. Therefore, anastasis could be one of the mechanisms underlying the observation that repeated tissue injury increases the risk of cancer in a variety of tissues40, such as liver damage due to alcoholism41, chronic thermal injury in the oesophagus induced by the consumption of very hot beverages42–44, evolution of drug resistance in recurrent cancers36–39,45, and development of a second cancer during subsequent therapy46–49. Anastasis can also occur in primary cardiac cells and neuronal cell lines30,31, and potentially in cardiomyocytes in vivo following transient ischemia50. These findings suggest anastasis as an unexpected cellular protective mechanism. Therefore, uncovering the mechanisms of anastasis may provide new insights into the regulation of cell death and survival, and harnessing this mechanism via suppression or promotion of anastasis would aid treatment of intractable diseases including cancer, heart failure and neurodegeneration.
Our previous study demonstrated reversibility of ethanol-induced apoptosis at late stages in mouse primary liver cells, and revealed that new transcription is important to reverse apoptosis30,31. During recovery, we found up-regulation of genes involved in pro-survival pathways and DNA damage responses during anastasis (Bag3, Mcl1, Dnajb1, Dnajb9, Hsp90aa1, Hspa1b, and Hspb1, Mdm2)30. Interestingly, inhibiting some of those genes by corresponding specific chemical inhibitors significantly suppresses anastasis30. However, the molecular mechanism of anastasis remains to be elucidated. To study the cellular processes of anastasis, we performed time-course RNA microarray analysis to determine the gene expression profiles of the cultured mouse primary liver cells undergoing anastasis following transient exposure to ethanol that triggers apoptosis, and identified unique gene expression patterns during reversal of apoptosis. We also performed reverse transcription polymerase chain reaction (RT-PCR) to validate the gene expression patterns in the human liver cancer cell line, HepG2, during anastasis. Here, we present our time-course microarray data, which reveals the molecular signature of anastasis.
Mouse primary liver cells were isolated from BALB/c mice using collagenase B and cultured as described30,51. The cells were cultured in in DMEM/F-12 (DMEM:nutrient mixture F-12) supplemented with 10% fetal bovine serum (FBS), 100 U/ml penicillin, and 100 μg/ml streptomycin (Life Technologies, Carlsbad, CA, USA) at 37°C under an atmosphere of 5% CO2/95% air. To induce apoptosis, cells were exposed to 4.5% ethanol for 5 hours (R0) in the culture medium (vol/vol). To allow recovery, dying cells were washed and further incubated in the fresh culture medium for 3 hours (R3), 6 hours (R6), 24 hours (R24), and 48 hours (R48). The untreated cells served as control (Ctrl). Three biological replicates were performed at each time point. Total RNA in the corresponding cell conditions was harvested using TRIzol Reagent (Life Technologies). The RNA was purified using the RNeasy Mini Kit (Qiagen, Cologne, Germany). Reverse transcription was performed using SABiosciences C-03 RT2 First Strand Kit to construct cDNA (SABiosciences-Qiagen, Frederick, MD, USA). The cDNA samples were analysed using the Illumina MouseWG-6 v2.0 Expression BeadChip (Illumina, San Diego, CA, USA).
The Partek Genomics Suite 6.6 (Partek, St. Louis, MO, USA) was used for principal component analysis (PCA)52,53. The Spotfire DecisionSite 9.1.2 (TIBCO, Palo Alto, CA, USA) platform was used to evaluate the fold change of gene expression levels between time points when compared with a common starting point, which is the control (Ctrl)54. Signal values were converted into log2 space and quality control tests were performed to ensure data integrity by comparing the signals of the three biological replicates at each time point. The fold change was based on averaged values of the three replicates at each time point; two-sample Student's t-test was used to determine statistical significance as p-values of less than 0.05, using the Partek Genomics Suite v6.5 (Partek Inc., St. Louis, MO, USA).
For the time-course gene expression analysis using Spotfire, all time points were compared with the time point Ctrl, which represents untreated cells. Spotfire was used to show the genes that displayed specific changes in gene expression after removal of cell death inducer for 3 hours (R3) and 6 hours (R6). Genes with specific and significant change (Log2 > 1 or <-1) in expression at the corresponding timepoint are highlighted. Interaction network analysis of the up-regulated genes during anastasis was performed using the GeneMANIA database (http://genemania.org/)55,56.
Cells were incubated with 50 nM Mitotracker Red CMXRos and 250 ng/ml Hoechst 33342 (Invitrogen) for 20 minutes in culture medium to stain mitochondria and nuclei, respectively. The stained cells were washed and incubated with culture medium for 10 minutes, and then were fixed with 3.7% (wt/vol) paraformaldehyde in phosphate-buffer saline (PBS) solution for 20 minutes at room temperature in dark. The fixed cells were mounted on glass slide using ProLong Diamond Antifade Mountant (Invitrogen). Cell images were captured with the Zeiss LSM 780 confocal inverted microscope using a 40×, numerical aperture (NA) 1.4 plan-Apochromat objective (Carl Zeiss, Jena, Germany), and were analyzed using Zen 2013 or AxioVision 4.2 software (Carl Zeiss).
Human liver cancer cell line HepG2 (ATCC HB-8065) was cultured in DMEM/F-12, 10% FBS, 100 U/ml penicillin, and 100 μg/ml streptomycin (Life Technologies) at 37°C under an atmosphere of 5% CO2/95% air. Apoptosis was induced by incubation of the cells with 4.5% ethanol in cell culture medium for 5 hours (R0). Then, the apoptotic dying cells were washed and then incubated in the fresh culture medium for 1 hour (R1), 2 hours (R2), 3 hours (R3), 4 hours (R4), 6 hours (R6), 9 hours (R9), 12 hours (R12), and 24 hours (R24). The untreated cells served as control (Ctrl). Total RNA in the corresponding cell conditions was harvested using QIAzol lysis reagent (Qiagen). The total RNA was purified using the RNeasy Mini Kit (Qiagen). Reverse transcription was performed using the SuperScript IV reverse transcriptase system (Thermo Fisher Scientific, Waltham, MA, USA). Primer sets for detecting targeted genes were designed using the Universal ProbeLibrary (Roche Applied Science, Madison, WI). Primer set for MMP10 was previously designed57. Polymerase Chain Reaction (PCR) was performed using Taq DNA Polymerase and PCR protocol (New England BioLabs, Ipswich, MA, USA), with initial denaturation at 95°C for 2 minutes, followed by 30 cycles of denaturation at 95°C for 30 seconds, annealing at 60°C for 30 seconds, and extension at 72°C for 3 seconds. Electrophoresis of PCR products was performed using 4% agarose gel.
We have demonstrated that mouse primary liver cells can reverse the apoptotic process at the execution stage30,31, despite reaching important checkpoints commonly believed to be the “point of no return”4–9, including caspase-3 activation, DNA damage, and cell shrinkage. To pursue the mechanisms of anastasis, we performed time-course high-throughput microarray to evaluate gene expression profiles during reversal of ethanol-induced apoptosis in mouse primary liver cells. RNA samples were collected from the untreated primary liver cells (Ctrl), the cells treated with 4.5% ethanol for 5 hours when cells exhibited hallmarks of apoptosis (R0), and the treated cells that were then washed and cultured in fresh medium for 3 (R3), 6 (R6), 24 (R24) and 48 (R48) hours. Apoptosis was confirmed in the ethanol-treated cells (R0), which displayed hallmarks of apoptosis, including plasma membrane blebbing, cell shrinkage, cleavage of caspase-3 and its substrates, such as PARP and ICAD (Figure 1A and B, images reprinted with permission30). The features of apoptosis vanished after removal of the cell death inducer (R24), indicating recovery of the cells (Figure 1A and B). Three biological replicates were performed at each time point. The principal component analysis indicated that all three biological replicates of each time point exhibited a very high correlation, as indicated by clustering, for the dataset of all 18 samples (Figure 2A; Supplementary Figure 1; see Data availability). The unsupervised hierarchical clustering confirms the similarity between all the replicates at each time point (Figure 2B; see Data availability; Supplementary Figure 2).
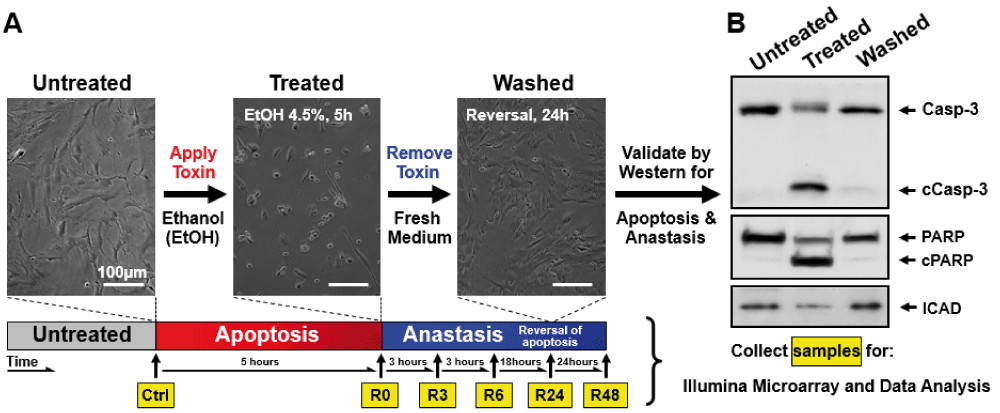
Mouse primary liver cells were treated with 4.5% ethanol for 5 hours (R0) and then washed and cultured in fresh medium for 3 (R3), 6 (R6), 24 (R24), and 48 (R48) hours. The untreated cells served as control (Ctrl). (A) Time-lapse live-cell light microscopy and (B) Western blot analysis validated apoptosis to occur at R0, and anastasis at R24. Cells were collected at the indicated timepoints of (A) for RNA extraction. Gene expression profiling was performed by microarray, and analysed by Spotfire. The images from Figure 1A and B are adopted from the Mol Biol Cell 23, 2240–52 (2012)30. Reprinted with permission.
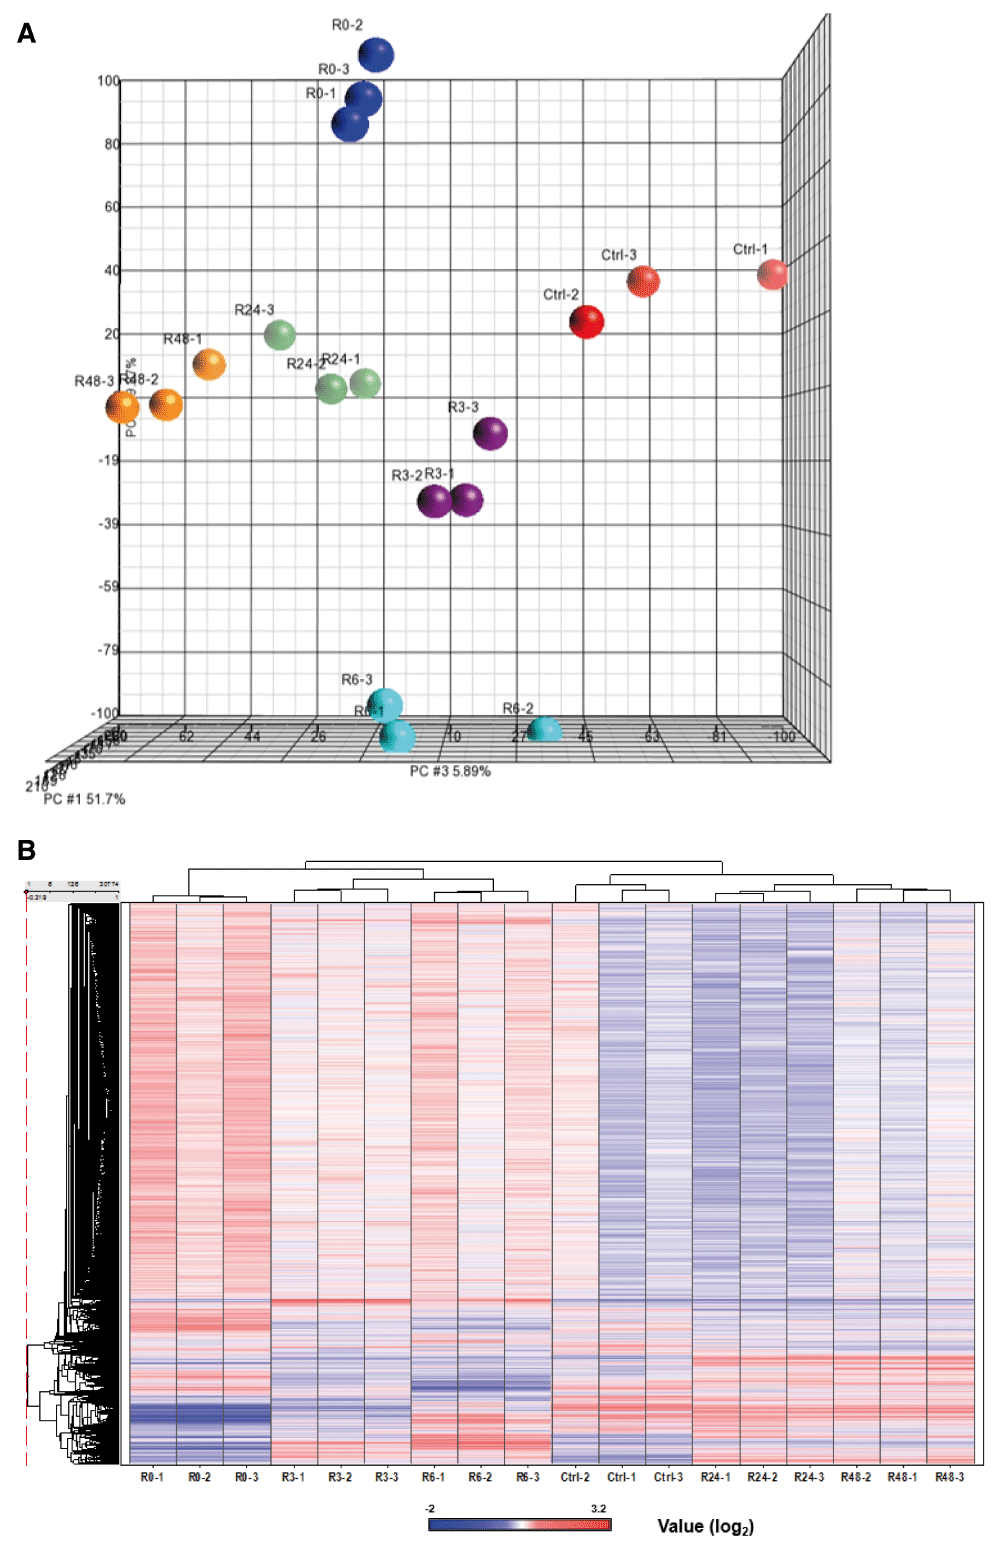
The three biological replicate samples of microarray data were shown to cluster together by using (A) principal component analysis (PCA) and (B) unsupervised hierarchical clustering of the RNA microarray data of eighteen samples.
Genes that display significant changes in expression during anastasis at the earliest time point of 3 hours, following the removal of the cell death inducer, may represent critical first responders of anastasis (Figure 3A, Table 1), including transcription factors of the activator protein-1 (AP-1) family (Atf3, Fos, Fosb, Jun, Junb), transforming growth factor-β (TGF-β) signal pathway and its related regulators (Inhba, Snai1, Tgif1, Sox4, Sox9, Klf4, Klf6, Klf9), pro-survival Bcl-2 family member (Bag3), inhibitor of p53 (Mdm2), anti-oxidation (Hmox1), anti-proliferation (Btg1), DNA damage (Ddit3, Ddit4), vesicular trafficking (Vps37b) and stress-inducible (Dnajb1, Dnajb9, Herpud1, Hspb1, Hspa1b) responses. Starting at 6 hours of anastasis, other groups of gene pathways display the peak of transcription, such as cell cycle arrest (Cdkn1a, Trp53inp1), autophagy (Atg12, Sqstm1), and cell migration (Mmp9, Mmp10 and Mmp13) (Figure 3B, Table 1 and Table 2). Expression of potent angiogenic factors, such as Vegfa and Angptl4, are up-regulated at 3 and 6 hours of anastasis, respectively (Table 1 and Table 2). Histones display up- (Hist1h2ae, H2afj) and down- (Hist1h2ak, Hist1h2ag, Hist1h2ap, Hist1h2af, Hist2h2ac, Hist1h2ah) regulations during the first 6 hours of anastasis (Table 2 and Table 3). Changes in expression of most of these genes peak at the 3–6-hour time points after removal of the apoptotic stimulus and then return to baseline (Figure 3A and B; Supplementary Figure 2). Interestingly, certain genes such as splicing of pre-mRNA (Rnu6), and growth arrest and DNA repair (Gadd45g) stay up-regulated during both apoptosis and anastasis (Figure 3C, Table 4).
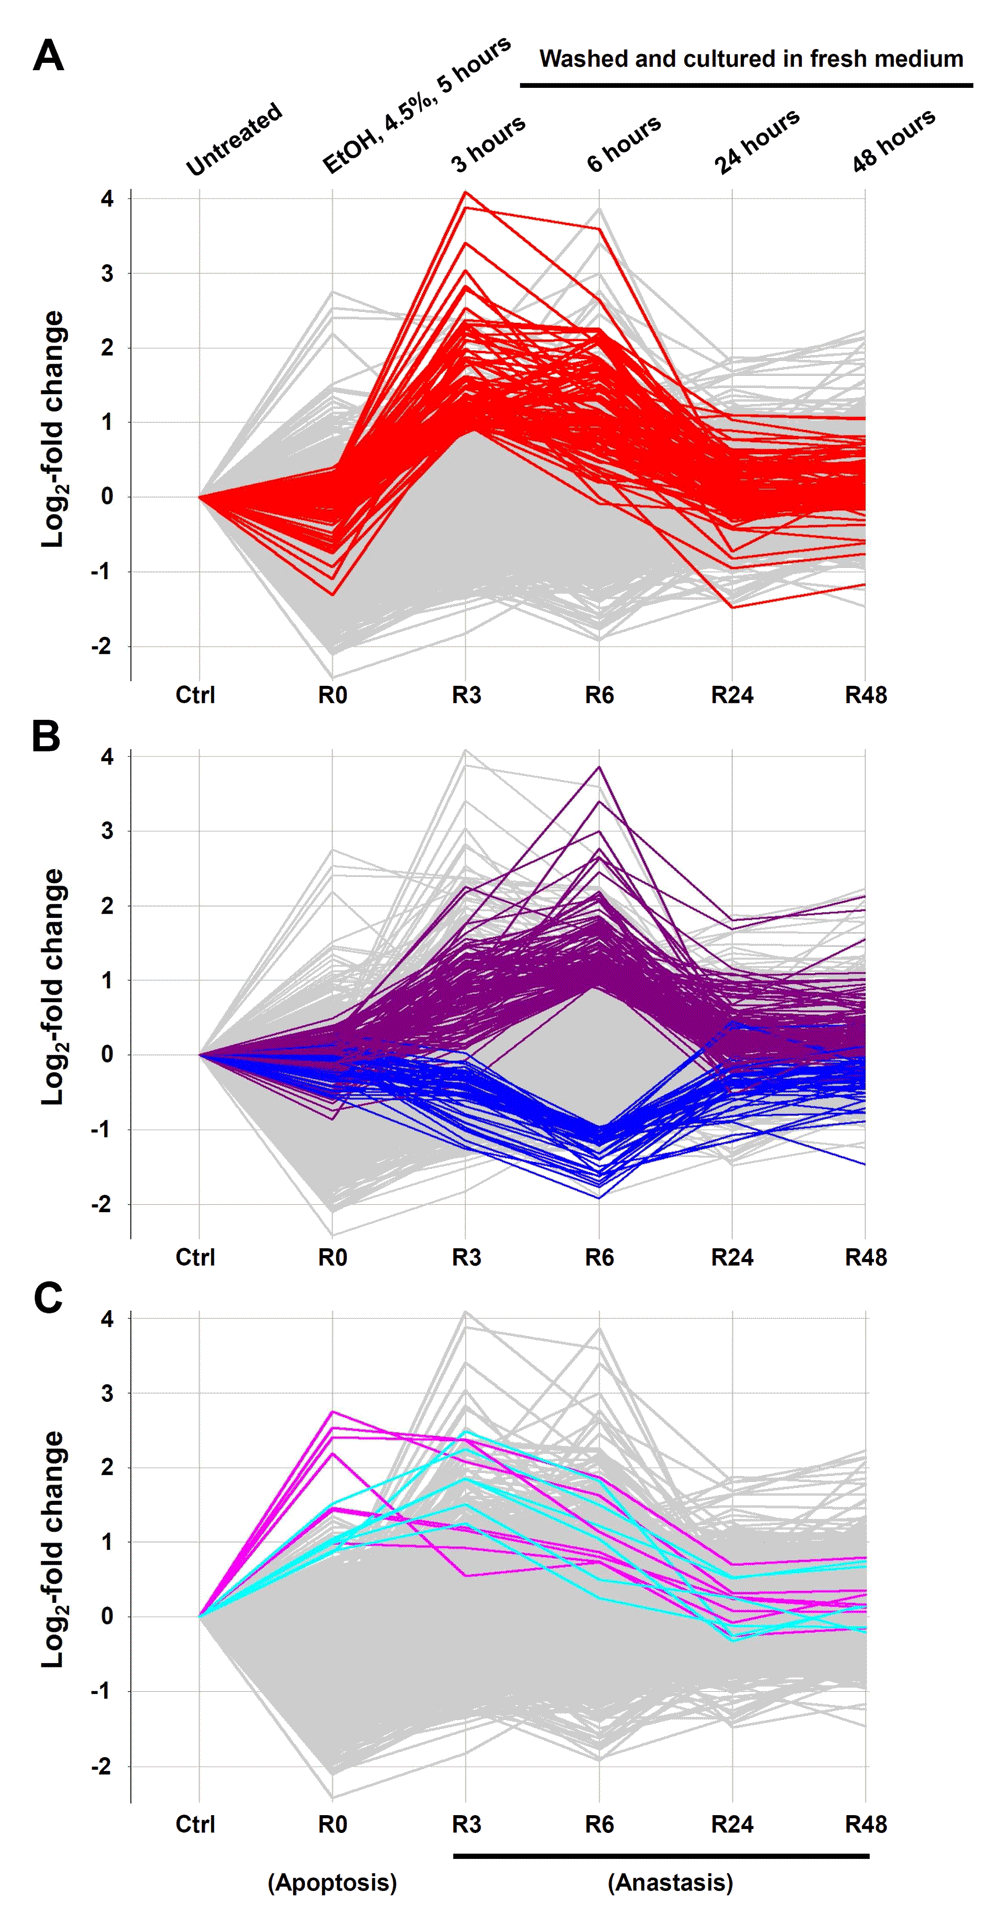
Log2-fold change of gene expression comparison between untreated cells (Ctrl), ethanol-induced apoptotic cells (R0), and induced cells that were then washed and further cultured in fresh medium for 3 (R3), 6 (R6), 24 (R24), and 48 (R48) hours. Genes that displayed specific (A) up-regulation at R3, (B) up- or down-regulation at R6, and (C) up-regulation anytime during the period from R0 to R6 with absolute log2 fold change >1 are highlighted. The log2 signal values from three biological replicates were averaged (geometric mean) for each time point.
We further observed the similar changes in gene expressions during anastasis in cultured human liver cancer HepG2 cells (Figure 4; see Data availability). The untreated HepG2 cells displayed tubular and filamentous mitochondria in the cells that spread on the substrate (Figure 4Ai, 4B). After exposure to 4.5% ethanol for 5 hours, the treated cells displayed morphological hallmarks of apoptosis, such as mitochondrial fragmentation, nuclear condensation, plasma membrane blebbing, and cell shrinkage (Figure 4Aii, 4B). After washed and incubated with fresh culture medium, the treated cells regained normal morphology (Figure 4Aiii, 4B). Interestingly, the HepG2 cells that underwent anastasis displayed the increase in micronuclei formation (Figure 4B), which is the biomarker of DNA damage58, as we previously observed in mouse primary liver cells, mouse embryonic fibroblast NIH 3T3 cells, human cervical cancer HeLa cells, and human small cell lung carcinoma H446 cells30,31. By using reverse transcription polymerase chain reaction (RT-PCR), we verified our microarray data on HepG2 cells during reversal of ethanol-induced apoptosis, and found similar gene expression patterns during anastasis, including changes in mRNA levels of ANGPTL4, ATF3, ATG12, CDKN1A, FOS, HSPA1B, JUN, MDM2, MMP10 and SOX9 (Figure 4C; Supplementary Figure 3). This suggests that the mechanism of anastasis is conserved between primary and cancer cells.
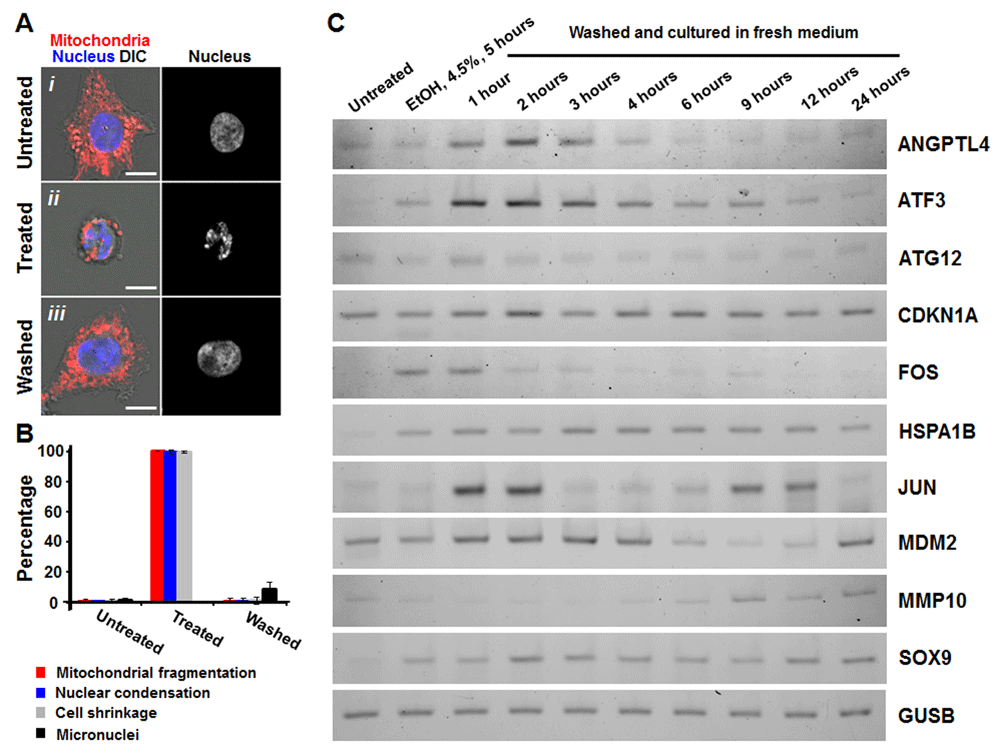
(A) Confocal and differential interference contrast (DIC) microscopy of untreated liver cells (i Untreated), cells that were exposed to 4.5% ethanol for 5 hours (ii Treated), and the treated cells that were washed to remove apoptosis inducer and further cultured for 6 hours (iii Washed). Merged images, mitochondria (red) and nuclei (blue) were visualized by confocal microscopy and cell morphology by DIC. Monochrome images, nucleus of the corresponding cells. Scale bar, 10 μm. (B) Quantification of the apoptotic response and its reversal on HepG2 cells. Percentage of the untreated cells, the treated cells (4.5% ethanol, 5 hours) and the washed cells (24 hours) showing mitochondrial fragmentation, nuclear condensation, cell shrinkage, and formation of micronuclei. (C) RT-PCR gel analysis of changes in mRNA levels of ANGPTL4, ATF3, ATG12, CDKN1A, FOS, GUSB, HSPA1B, JUN, MDM2, MMP10 and SOX9 on the untreated (Ctrl), the treated (R0, 4.5% ethanol for 5 hours), and the treated cells that were then washed and incubated in fresh medium for 1 hour (R1), 2 hours (R2), 3 hours (R3), 4 hours (R4), 6 hours (R6), 9 hours (R9), 12 hours (R12), and 24 hours (R24). GUSB serves as housekeeping gene. Sequences of primer sets for detecting targeted genes are available in Table 5.
The change in transcriptional profiles during anastasis provides us mechanistic insights into how dying cells could reverse apoptosis (Figure 5). In early anastasis, our data reveals that the regulators of the TGF-β signalling pathway, which control various fundamental cellular and pathological process, including proliferation, cell survival, apoptosis, cell migration, and transformation59–62, are upregulated. The activation of the TGF-β pathway is further supported by the upregulation of AP-1 (Jun-Fos)59, as observed here during early anastasis. The up-regulation of the TGF-β pathway can also promote the expression of murine double minute 2 (Mdm2)63,64, an inhibitor of p53 that is also up-regulated during early anastasis30. As p53 plays a critical role in regulating apoptosis and DNA repair65,66, the expression of Mdm2 could not only promote cell survival by inhibiting p53-mediated cell death, but also cause mutations as we have observed in the cells after anastasis30. Expression of Mdm2 can also activate XIAP67, which inhibits caspases 3, 7 and 968–73, and therefore, could promote anastasis by suppressing the caspase-mediated cell destruction process. Up-regulation of anti-apoptotic BCL2 protein (Bag3) and heat shock proteins (Hsps) during anastasis can also neutralize pro-apoptotic proteins to promote cell recovery26,74,75. Expression of Hmox1, which encodes heme oxygenase76, could protect dying cells from free radicals that are generated during apoptosis. Notably, the expression of Bbc3, a pro-apoptotic BH3-only gene to encode PUMA (p53 upregulated modulator of apoptosis)77,78, peaks at anastasis (R3-R6), suggesting the sign of anastasis vs apoptosis in the recovering cells during the early stage of the cell recovery process.
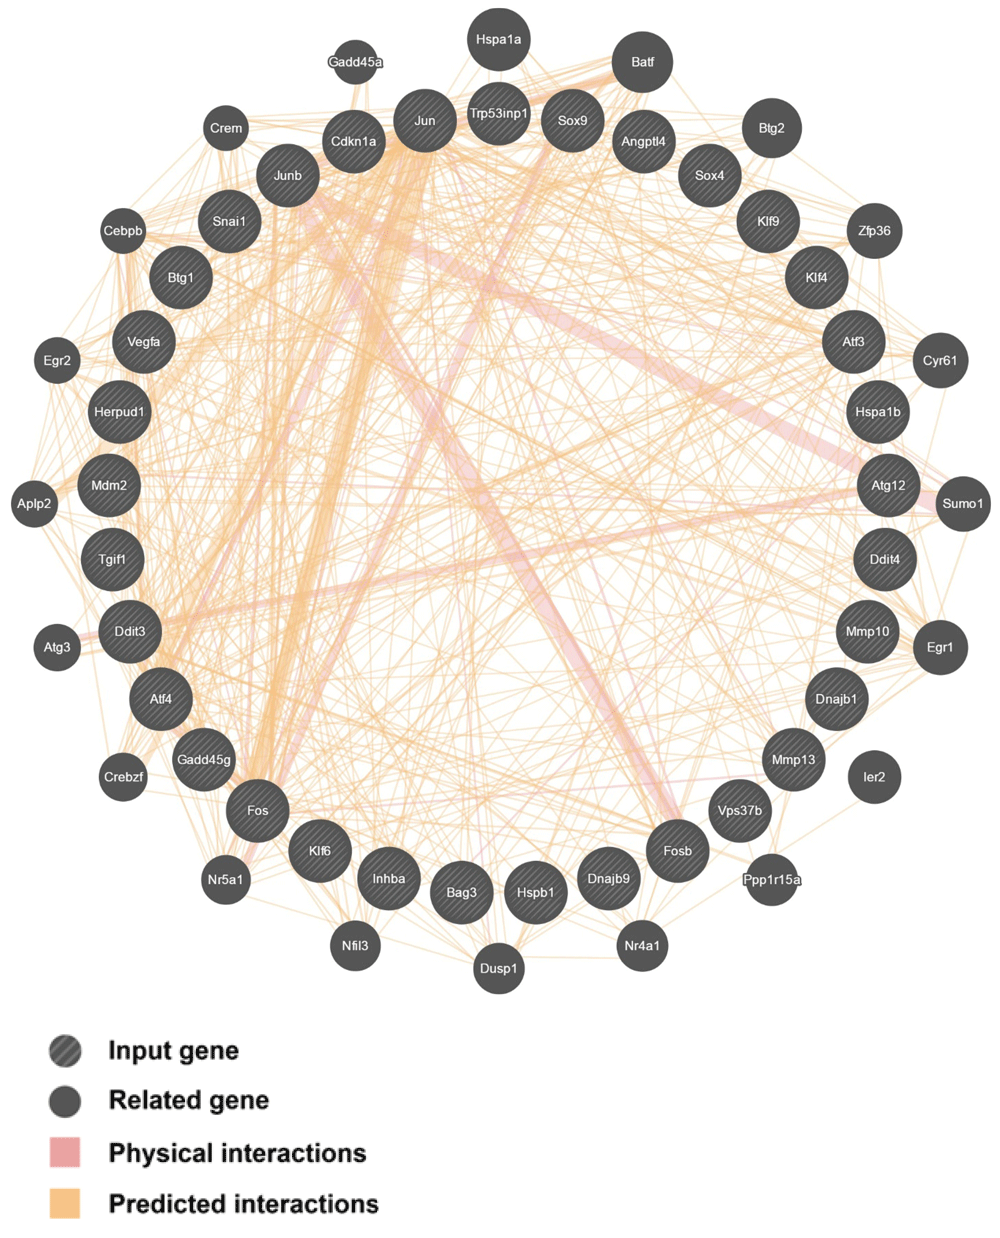
The 33 up-regulated genes during anastasis were selected for analysis using GeneMANIA.
To reverse apoptosis, the recovering cells need to remove or recycle the destroyed cellular components, such as the toxic or damaged proteins that are cleaved by caspases, and dysfunctional organelles like the permeabilized mitochondria. Autophagy could contribute to anastasis, as the recovering cells display up-regulation of Atg12 (Figure 3B, Table 2), which is important to the formation of autophagosome to engulf the materials that are then transported to lysosomes or vacuoles for degradation79–82. Sqstm1, which encodes sequestosome 183–85 and is up-regulated at R6, could play important role in mediating autophagy and DNA damage response during anastasis. In fact, recently studies reveal that autophagy can be activated by the DNA damage response, and play a role in maintaining the nuclear and mitochondrial genomic integrity through DNA repair and removal of micronuclei and damaged nuclear parts86,87. This could suppress mutagenesis and oncogenic transformation to occur in the cells that reverse apoptosis as we have observed after DNA damage30,31. Autophagy is also implicated in the exosome secretory pathway88–90, which could allow rapid clearance of damaged or toxic materials during anastasis through exosomes. Interestingly, our microarray data shows that the recovering cells display up-regulation of potent angiogenic factors such as Vegfa and Angptl4 (Figure 3A and B, Table 1 and Table 2), which promote vascular permeability and angiogenesis91–94. This could facilitate anastasis by supplying nutrient and clearing waste products. However, this could also enhance tumour recurrence, progression and metastasis95, when anastasis occurs in cancer cells between cycles of cancer therapy. In fact, our data also reveals the up-regulation of genes involved in cell migration during anastasis30, such as Mmp 9, 10 and 13 (Figure 3B, Table 2) that encode matrix metalloproteinases96–99. This could be a stress-inducible response that promotes cell migration, like what we have observed in HeLa cells after anastasis (Supplementary Figure 4)31, which might contribute to wound healing after tissue injury, or metastasis during cancer recurrence100,101.
Change in expression of histone proteins contributes to histone modification, which plays critical role in transcription, DNA replication and repairing102–106. At the late stage of anastasis (R6), various histone genes display significant changes in expression (Table 2, Table 3), suggesting potential connection between histone modification and reversal of apoptosis. Interestingly, significant number of histone genes are down-regulated during anastasis (Table 3). Recent study reported histone degradation in response to DNA damage, and that is important for DNA repairing107. As dying cells can reverse apoptosis after DNA damage30,31, reduction of histone gene expression could represent the DNA damage response during anastasis.
Arresting cell cycle during anastasis is important as it can allow damaged cells to be repaired before they restore proliferation. This hypothesis is supported by our microarray data that reveals up-regulation of genes that suppress cell cycle (Figure 3A–C). For example, B-cell translocation gene 1 (Btg1) is an anti-proliferative gene108,109, which is up-regulated during the early anastasis (R3). At later stage of anastasis (R6), other cell cycle inhibitors express, including Cdkn1a which encodes p21 that induces cell cycle arrest and senescence110–112, and also Trp53inp1 which encodes tumor protein p53-inducible nuclear protein 1 that can arrest cell cycle independent to p53 expression113. These suggest that cell cycle is suppressed by multiple pathways during anastasis.
We also identified genes that are up-regulated both during apoptosis and anastasis, such as Gadd45g, and Rnu6 (Figure 3C, Table 4). Gadd45g functions in growth arrest and DNA repair114,115, and therefore, could be the cytoprotective mechanism that preserves DNA in the dying cells during cell death induction (R0), and promotes the injured cells to repair when the environment is improved (R3 and R6). Rnu6 encodes U6 small nuclear RNA, which is important for splicing of a mammalian pre-mRNA116–119. Upregulation of Rnu6 from R0 to R6 suggests that post-transcriptional regulation could be involved during apoptosis and anastasis. In fact, translational regulation also contributes to anastasis. For example, caspase-3, PARP and ICAD are cleaved in dying cells during apoptosis, and the non-cleaved form of corresponding proteins restores after anastasis (Figure 1B). Interestingly, the mRNA level of caspase-3, PARP and ICAD did not show significant increase during and after anastasis (see Data availability). This suggests the contribution of translational regulation during anastasis.
Our study provides new insights into the mechanisms and consequences of anastasis (Figure 6). Researchers can analyse our microarray data to further identify the hallmarks of anastasis, understand its role, elucidate molecular mechanisms that reverse apoptosis, and develop therapeutic strategies by controlling anastasis. To identify the genes that display specific change on a transcriptional level, software such as Spotfire can be used to view the gene expression pattern at different time points during the reversal of apoptosis54. To study the molecular mechanism of anastasis, Ingenuity Pathway Analysis can be used to create mechanistic hypotheses according to the transcriptional profile120. To identify drugs that modulate anastasis, Connectivity Map can be used to identify small molecules that promote or suppress anastasis based on its gene expression signature121,122. Anastasis could be a cell survival phenomenon mediated by multiple pathways29–31,33, so by comparing the gene expression profiles, researchers can study its potential connection to other cellular processes, such as anti-apoptotic pathways, autophagy, and stress-inducible responses82,123–127. By searching the molecular signature of anastasis, researchers can study its potential contribution to physiological and pathological conditions, such as recovery from heart failure, wound healing, mutagenesis, tumour evolution, cancer recurrence and metastasis45,100,101,128. Further data analysis will stimulate the generation of hypotheses for future studies involving anastasis. As our understanding of anastasis mechanism expands, it will uncover its potential impacts on physiology and pathology, and offer exciting new therapeutic opportunities to intractable diseases by mediating cell death and survival (Figure 7).
Figshare: Raw data for Tang et al., 2016 “Molecular signature of anastasis for reversal of apoptosis” doi: 10.6084/m9.figshare.4502732
H.L.T., H.M.T. and M.C.F. conceived the idea and designed the research; H.L.T. and H.M.T. wrote the article, conducted the analyses together with C.C.T. and M.C.F. All authors agreed to the final content of the manuscript.
This work was supported by the Shurl and Kay Curci Foundation of the Life Sciences Research Foundation fellowship (H.L.T.).
The funders had no role in study design, data collection and analysis, decision to publish, or preparation of the manuscript.
We thank J. Marie Hardwick for valuable advice to this work, and the Johns Hopkins Deep Sequencing and Microarray Core Facility for data analysis. Ho Lam Tang is a Shurl and Kay Curci Foundation Fellow of the Life Sciences Research Foundation.
Supplementary Figure 1: Technical validation of microarray data. The three biological replicate samples of microarray data were shown to cluster together by using principal component analysis (PCA).
Supplementary Figure 2: Genes display unique expression patterns at each timepoint. Output of all genes analysed by Spotfire (K cluster, also see Data availability).
Supplementary Figure 3. Uncropped agarose gel images. RT-PCR gel analysis of changes in mRNA levels of ANGPTL4, ATF3, ATG12, CDKN1A, FOS, HSPA1B, JUN, MDM2, MMP10 and SOX9 on untreated (Lane 1: Ctrl), treated (Lane 2: R0, 4.5% ethanol for 5 hours), and the treated cells that were then washed and incubated in fresh medium for 1 hour (Lane 3: R1), 2 hours (Lane 4: R2), 3 hours (Lane 5: R3), 4 hours (Lane 6: R4), 6 hours (Lane 7: R6), 9 hours (Lane 8: R9), 12 hours (Lane 9: R12), and 24 hours (Lane 10: R24). GUSB serves as housekeeping gene. Lane M is loaded with 25 bp DNA Ladder (Invitrogen). Sequences of primer sets for detecting targeted genes are available in Table 5.
Supplementary Figure 4: Increase in mobility of HeLa cells after reversal of ethanol-induced apoptosis. Time-lapse live-cell fluorescence microscopy of HeLa cells before, during, and after exposure to the apoptotic stimulus, ethanol. The same cells before ethanol induction (Untreated, i), induced with 5% ethanol in culture medium for 55 minutes (Induced, ii to iv), and then washed and further cultured with fresh medium (Washed, v to xx). Green, white and yellow lines indicate the footprints of the corresponding same cells that reversed apoptosis throughout the experiment with time. Cells without displayed hallmarks of apoptosis at late stage, such as cell shrinkage and nucleus condensation (without track), had lower mobility than the tracked cells. Merged images, mitochondria (red) and nuclei (blue) were visualized by fluorescence, and cell morphology by differential interference contrast (DIC) microscopy. Time presented as hour:minute. Scale bar, 10 μm. Adopted images reprinted with permission129.
| Views | Downloads | |
|---|---|---|
| F1000Research | - | - |
|
PubMed Central
Data from PMC are received and updated monthly.
|
- | - |
Competing Interests: No competing interests were disclosed.
Competing Interests: No competing interests were disclosed.
Competing Interests: No competing interests were disclosed.
Competing Interests: No competing interests were disclosed.
Alongside their report, reviewers assign a status to the article:
| Invited Reviewers | |||
|---|---|---|---|
| 1 | 2 | 3 | |
|
Version 2 (revision) 09 Feb 17 |
read | read | |
|
Version 1 13 Jan 17 |
read | read | |
Provide sufficient details of any financial or non-financial competing interests to enable users to assess whether your comments might lead a reasonable person to question your impartiality. Consider the following examples, but note that this is not an exhaustive list:
Sign up for content alerts and receive a weekly or monthly email with all newly published articles
Already registered? Sign in
The email address should be the one you originally registered with F1000.
You registered with F1000 via Google, so we cannot reset your password.
To sign in, please click here.
If you still need help with your Google account password, please click here.
You registered with F1000 via Facebook, so we cannot reset your password.
To sign in, please click here.
If you still need help with your Facebook account password, please click here.
If your email address is registered with us, we will email you instructions to reset your password.
If you think you should have received this email but it has not arrived, please check your spam filters and/or contact for further assistance.
Comments on this article Comments (0)