Keywords
protein staining, Human Protein Atlas, marker genes, marker proteins, exploratory analysis
This article is included in the RPackage gateway.
This article is included in the Bioconductor gateway.
This article is included in the Cell & Molecular Biology gateway.
This article is included in the Bioinformatics gateway.
protein staining, Human Protein Atlas, marker genes, marker proteins, exploratory analysis
The Human Protein Atlas (HPA) has performed immunohistochemistry-based visual proteomics for over 15,313 proteins across 59 tissues. Within each tissue a number of different cell types have been scored for staining patterns by a group of pathologists. Therefore, there is a great amount of visual proteomic data that can be used to classify gene or protein lists into specific cell types1–3. Their website is designed to query one protein of interest at a time and there is no option to query a list of proteins to determine if that protein set is enriched in a particular cell type. This would be a useful feature to take advantage of this robust dataset. Other gene list tools such as Enrichr, which query multiple databases for associations, have not incorporated the HPA protein cell expression dataset into their tools4.
We introduce HPAStainR (https://32tim32.shinyapps.io/HPAStainR/), a Bioconductor R package and Shiny app developed to query the cell staining database of the HPA. HPAStainR allows a user to input a list of proteins/genes and returns a rank ordered list of cell types that are stained for the input list. HPAStainR is customizable, allowing the user the ability to include cancer or normal tissue data, change the HPA confidence levels, toggle the identification of what proteins from the list were detected, generate a p-value for how many cell type specific proteins are counted for a given cell type, and allow the downloading of the output as a comma separated (csv) file.
The user interface of Shiny HPAStainR is made of a sidebar where one can input their protein/gene list, along with various options to customize the output of the Shiny app. The main panel consists of two tabs. The first tab is the output tab, where the DataTable from the user’s query is output. The second tab is informational giving the user a list of HPA cell types and how many proteins were tested/histologically scored in a given cell type.
The HPAStainR package is available on Bioconductor. The package shares all of the same functionality as the Shiny web application, including the ability to run the Shiny app locally and acquire all of the data to do so. This allows HPAStainR to be used as the Shiny app or incorporated into a local R pipeline.
HPAStainR is an online Shiny app5, available at http://shinyapps.io, and as a Bioconductor R Package (https://bioconductor.org/)6 with its source code available on GitHub (https://github.com/tnieuwe/HPAStainR). The function has been tested on R version 3.6.1 and later. Minimal requirements are the same as RStudio’s system requirements [https://bit.ly/2UqwXc6].
Installation: The installation of the HPAStainR package can be done in R using the following commands:
`if (!requireNamespace("BiocManager", quietly = TRUE))
install.packages("BiocManager")`
`BiocManager::install(version='devel')`
`BiocManager::install("HPAStainR")`
The remote-Shiny web application can be accessed via the following link:
https://32tim32.shinyapps.io/HPAStainR/
Input: There are three required R objects for the main HPAStainR function to work and one optional data frame. The first two required objects are the public staining files from the HPA, which can be downloaded using the package and the `HPA_data_downloader` function. The third required input is either a vector of proteins or genes or a character list of proteins separated by a space, comma, or newline to be queried in HPAStainR. The optional data frame, used in the Shiny app version of HPAStainR, is a table that contains the percent of proteins that stained the tissue compared to the number of the proteins evaluated in the tissue, represented in Extended Table 17, which can be generated using the `hpa_summary_maker.R` function. This table demonstrates that not all cell types/tissues have the same number of proteins stained for.
Output: Either a Shiny DataTable or tibble containing the summarized detection of the input list of proteins or genes for each available cell type customized by the options selected before running the analysis.
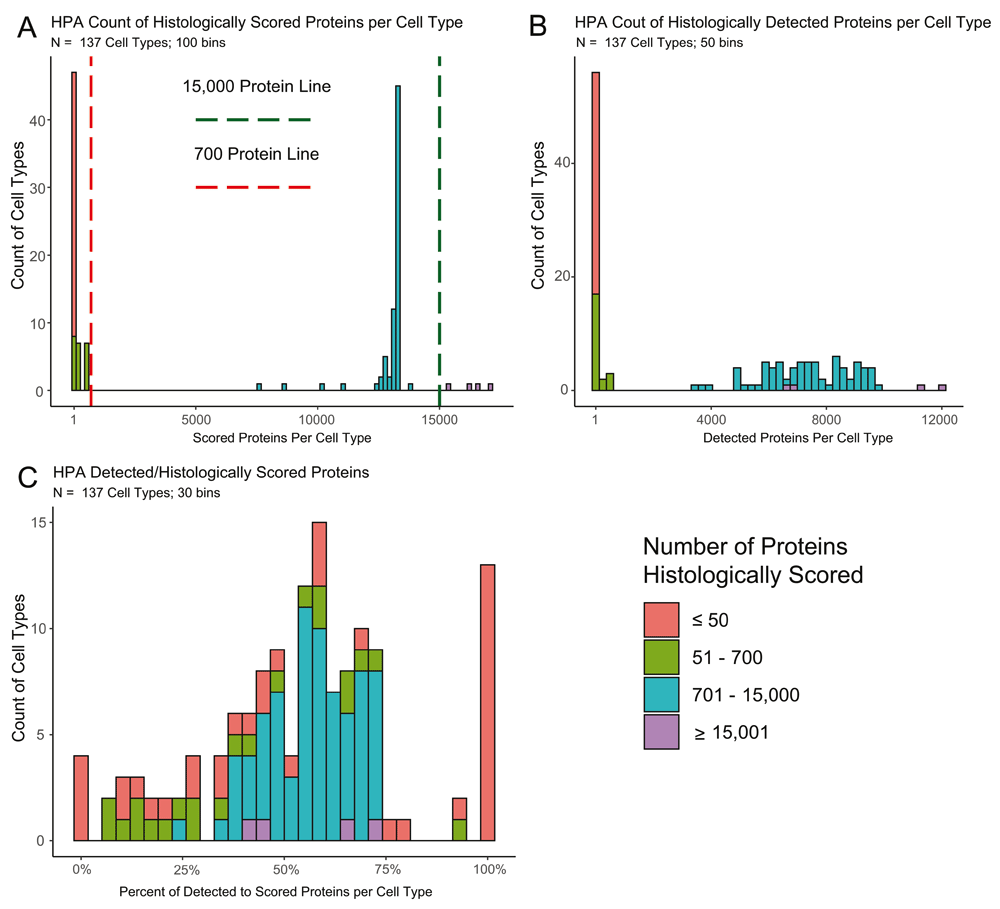
Staining was scored by cell type in each tissue by a group of pathologists who rated the intensity in each evaluated cell type as “high, medium, low or not detected.” Not all cell types in all tissues were scored, nor were all cell types consistently evaluated. As a result, there are some caveats in the HPA data that should be noted. The distribution of how many proteins are histologically scored in each of the 137 cell types varies in HPA, such that not all results are equal. The number of proteins scored in cell types ranges from 1 in four substantia nigra cell types to over 17,000 in endometrial glandular cells (Figure 1A; Extended Table 17), impacting how often a protein is detected in a given cell type (Figure 1B). The percent of stained to scored proteins demonstrates an enrichment at both extremes of the distribution (Figure 1C). To highlight this discrepancy in testing, we have made the information in Extended Table 1 as an available tab on the Shiny app.

A. A histogram of the 137 cell types showing the amount of proteins histologically scored in each cell type. Four cell types were evaluated for >15,000 proteins (green line) and 61 for <700 proteins (red line). B. A histogram of the 137 cell types on the amount of proteins that had positive staining in each cell type. C. A histogram of the percent of positively stained proteins to the total amount of histologically scored proteins for the given cell type. The extreme ends of the distribution are populated by samples with less than 700 scored proteins.
The staining score calculation is an arbitrary measure of how well an input list of proteins are enriched for a particular cell type. A formal equation is below, but briefly, it is calculated based on the frequency and intensity of staining within a given cell type. Staining intensity is a percentage of high, medium, low, and not detected counts. The high percentage is multiplied by a value of 100, the medium percentage by 50, and the low percentage by 25, before adding all the results together to generate the final staining score. While arbitrary, we over-weighted high staining as the IHC was more robust and those proteins may better define the cell type.
The model for the staining score equation is below where t is the total number of proteins from the list tested in the cell type, h is the number of proteins with high staining in the cell type, m is the number of proteins with medium staining in the cell type, and l is the number of proteins with low staining in the cell type.
The confidence score is unique to this paper in its comparison of the Panglao Database (PanglaoDB) cell types, and is a modified version of the staining score adjusting for size of the protein list for each cell type from PanglaoDB. Like the staining score, this score ranges from 0–100. The model for the equation is below, where p is the number of proteins tested, with a max p being 50 (standardizing the score range), and the staining score of the protein list in the cell type is represented by s.
While we utilized all expressed proteins in our staining score, we recognize that some proteins demonstrate cell type enrichment. For this analysis we generated the “enriched-protein p-value” based on a χ2 analysis.
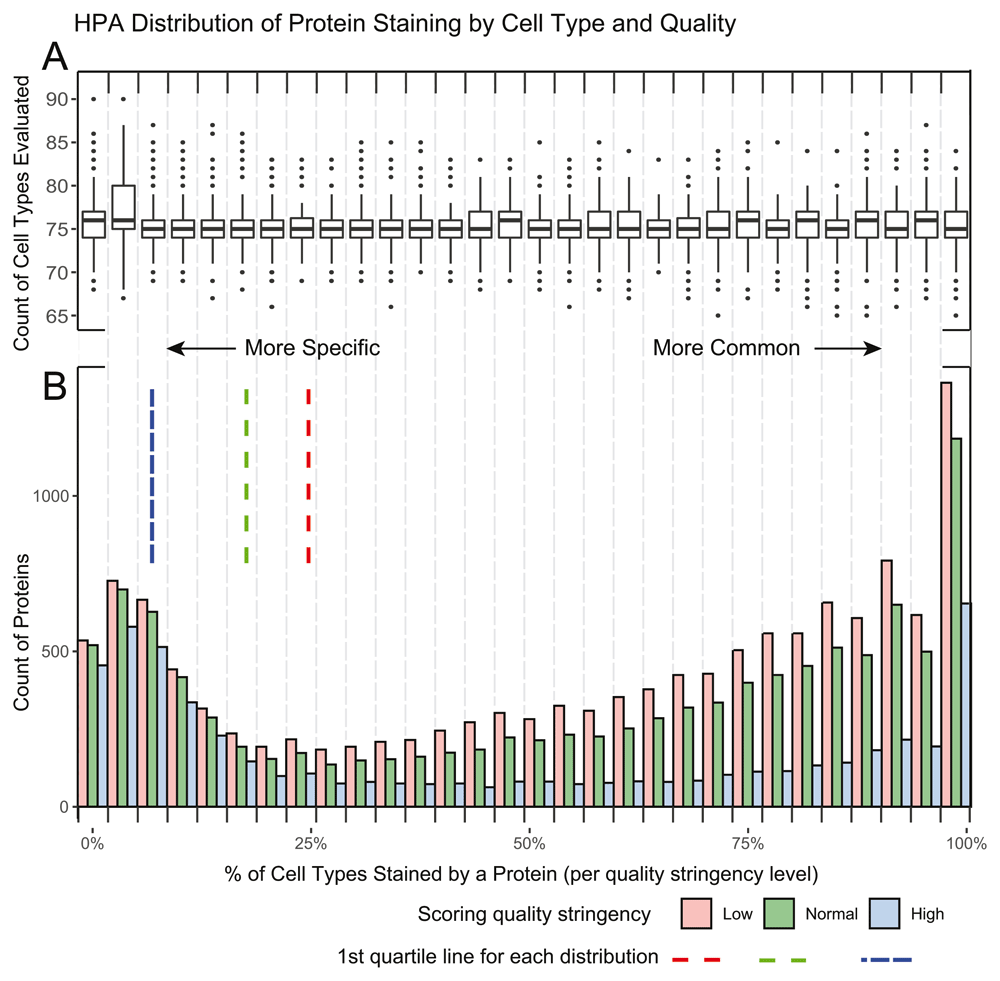
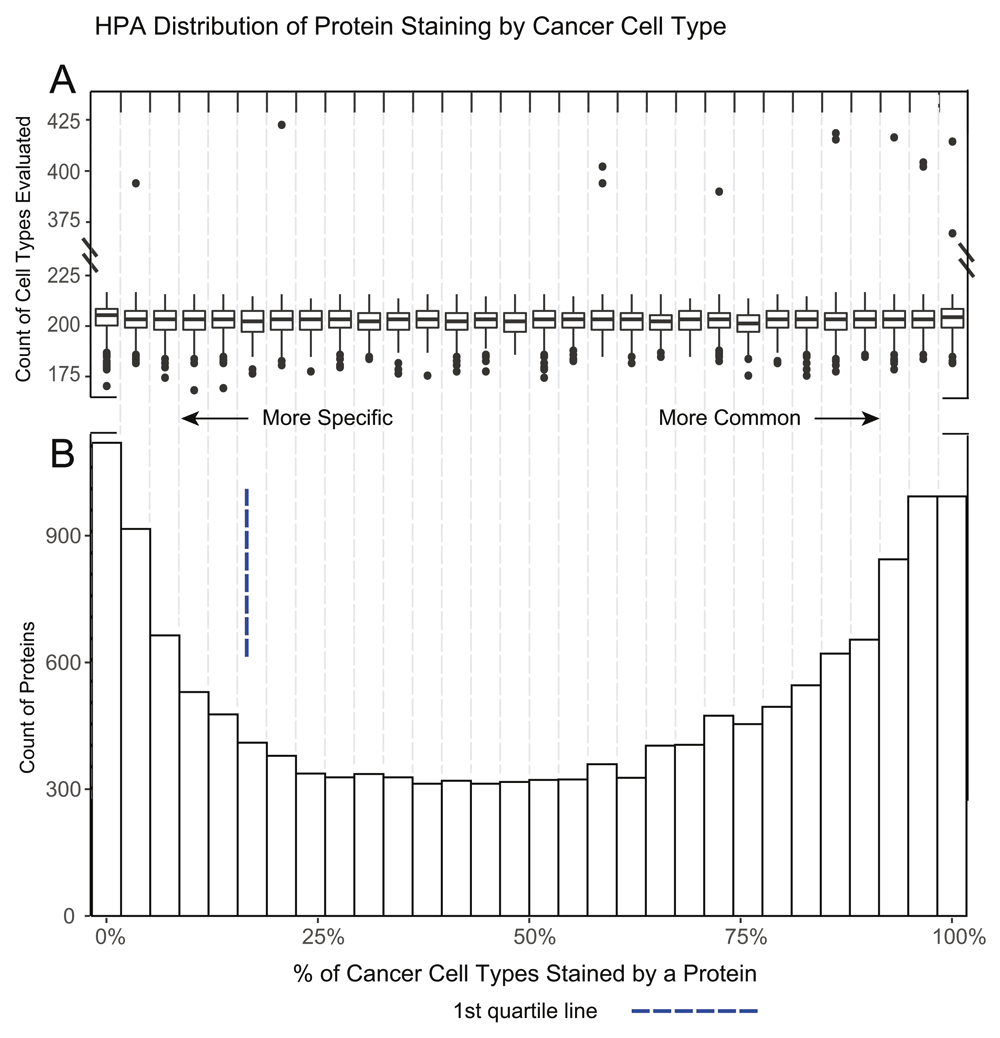
To calculate the enriched-protein p-value we generated a list of cell type enriched proteins for each level of stringency, low, normal and medium. This was done by calculating a percentage of positively stained to evaluated proteins across each cell type to adjust for protein scoring frequency. This percentage generated our ‘enriched proteins’ list from the top quartile of enriched proteins (the proteins present in <25% of the evaluated cell types. The number of proteins were 3,275, 2,543, and 1,235 for low, normal, and high stringency respectively and 3,818 in cancer) (Extended Tables 2 and 37; Figure 2 and Figure 3). The χ2 analysis was based on the staining presence/absence of ‘enriched proteins’ for a given HPA cell vs presence/absence of proteins from a protein list query. For all experiments in this paper, stringency was set to normal.

A. A boxplot of the number of cell types evaluated per protein in each of the 30 histogram bins. The overall median of cell types is 75 proteins with the 1st and 3rd quartile being 74 and 77 proteins respectively. B. A histogram demonstrating the percent of positive staining cells per protein. Three quality stringencies are given. The 1st quartile lines demonstrate the specificity cut off of the distribution used at each stringency level. As expected, the number of proteins in the 1st quartile increase with lower stringency.

A. A boxplot of the number of cell types evaluated per protein in each of the 30 histogram bins. The overall median of cancer cell types is 203 with the 1st and 3rd quartile of 199 and 207 respectively. A number of outliers with ~2x more cell types evaluated are noted. B. A histogram demonstrating the percent of positive staining cancer cells per protein. This distribution is different from normal tissue as some cancer samples of the same cancer type can positively stain for a protein while other samples will not.
All code for the package and the analysis can be found on GitHub at https://github.com/tnieuwe/HPAStainR and https://github.com/tnieuwe/HPAstainR_dev_paper, respectively.
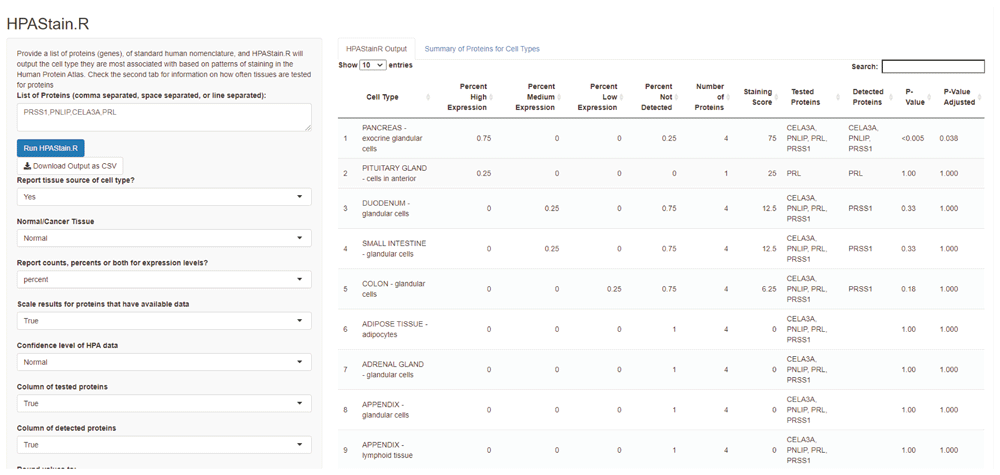
HPAStainR uses the publicly available HPA cell type histologically scored staining data to identify the top cell type matches to a queried protein/gene list. It ranks cell types on a 0 to 100 “staining score” (Figure 4). This score is based on the pathologist annotated staining intensity (high, medium, low) of each protein/gene in the query list for each HPA cell type, as a percent of the total number of proteins/genes queried (see Methods). For example, a query of the pancreatic enzymes PRSS1, PNLIP, and CELA3A, along with the protein PRL, would identify “pancreas exocrine glandular cells” as the top hit with a staining score of 75 due to the high staining intensity in three proteins and negative staining of the fourth protein. The second hit would be the “pituitary gland cells in anterior” due to PRL’s high expression in that cell type (score of 25), followed by “intestinal glandular cells” which only have medium staining of PRSS1 (score of 12.5).

A list of comma, space, or line separated proteins or genes are inputted on the left column. Multiple customizations are available for users below to optimize the search parameters for their query of interest. Data is outputted to the right, and further information about the cell types and how many proteins were histologically scored per cell type are available as a second tab.
To show the functionality of the Shiny app we applied HPAStainR to the Panglao Database, a hub of community-curated cell type markers from single cell data8. We wanted to investigate how well HPAStainR would mark the cell types based on PanglaoDB’s annotations. We downloaded a tsv file of PanglaoDB’s cell type gene marker data, and parsed it down to only human protein coding marker genes. We assayed 146 human cell types and their 3,661 marker genes through HPAStainR. The number of marker genes per cell type in PanglaoDB are variable, ranging from one marker in trophoblast stem cells to 216 in interneurons. A histogram of markers per cell type showing the distribution can be found in Figure 5.
To perform analyses between multiple runs of HPAStainR we generated a “confidence score,” a value (theoretical 0–100) that corrected for the staining score’s determination using an additional feature of how many proteins were evaluated (see Methods). This score weighted cell types with multiple marker proteins staining over cell types with a single or fewer marker proteins. Thus, the confidence score allowed us to rank the cell types based on both staining and depth of data.
HPAStainR is agnostic to the source of a protein/gene list. Therefore, an identification of equivalent cell types across two methods provides strong evidence of HPAStainR’s usefulness. Specific protein lists, corresponding to the 146 cell types were evaluated from PanglaoDB in HPAStainR with the top HPA cell types identified for each. To cover both potential user needs, we included in our PanglaoDB output both the top result of HPAStainR and the top result in the appropriate tissue. The confidence score across these comparisons, generated on HPAStainR data, ranged from 1.5 to 66.75. The results of the 146 cell types were divided into quartiles (Qs) based on the confidence score. The average number of proteins associated with a PanglaoDB cell type used to identify the top HPA cell type strongly correlated with the quartile (76.3; 55.7; 23.9; 7.7 proteins in Q1 to Q4, respectively). In the top quartile of scores, 75% (27/36) of cells matched between PanglaoDB and HPA. Of the nine that were not a perfect match, six matched the top hit when limited by tissue type. Of the remaining Q1 PanglaoDB cell types, liver kupffer cells (a type of macrophage), mesothelial cells, and embryonic stem cells, none had matching cell types in the HPA9.
A subset of this analysis can be seen below in Table 1 with the full results being in Extended Table 47. Results were ranked by confidence score, with a strong correlation of higher confidence scores to more accurate cell type assignments between PanglaoDB and HPA. An interesting example are chondrocytes, where the top stained score (27.25) was to TONSIL squamous epithelial cells and the top tissue specific cell type was SOFT TISSUE - chondrocytes (20.75). In addition to the stain score, HPAStainR provides a p-value (and Holm adjusted p-value) based on a separate metric based on cell type specific/enriched protein expression (see Methods). Although tonsil squamous epithelial cells is the top HPAStainR result, the adjusted enriched protein p-value was 1.0 (nonsignificant) while it was p=0.043 for the chondrocytes, indicating cell-enriched proteins favored the correct match.
Both the overall top HPAStainR result and a tissue-specific result is given. The “Select Tissues” results are from a search performed for the PanglaoDB cell type only within the matched tissue type (ALL CAPITALIZED) in HPA.
We then demonstrated the functionality of HPAStainR in bulk datasets. We utilized the variable gene expression data from the Genotype Expression (GTEx) dataset that we had previously uncovered as being driven by variation in pneumocytes or the presence of bronchial epithelium10. There were 33 genes identified in the pneumocyte cluster and 70 genes in the bronchial epithelium cluster. HPAStainR was applied separately to both lists and found the top results to be lung pneumocytes and bronchus respiratory epithelial cells respectively (Figure 6A and 6B; Extended Tables 5 and 67). Therefore, across both single cell and bulk gene expression data, we have identified useful functionality to HPAStainR.
HPAStainR fills a small gap in our knowledge base by allowing for the query of gene/protein lists against the cellular protein expression pattern data of HPA. As datasets of single cell RNA sequencing analysis become available, it is useful to have a tool to correlate these individual cellular transcriptomic gene profiles with translated protein expression patterns. We have also shown the tool can recapitulate bulk RNA sequencing findings making it a valuable tool to understand the cellular composition of a sample. The HPA is an excellent resource to observe staining patterns within cells across tissues for proteins of interest. The limitations of the study are the quality of the staining across all HPA tissues and the quality/consistency of the pathology scoring of the tissues11. Both of these may impact the scoring achieved for any given query. HPAStainR is a new valuable resource to accelerate exploratory and ground truth queries in the HPA cell type protein staining data.
The data from PanglaoDB was downloaded at https://panglaodb.se/markers/PanglaoDB_markers_27_Mar_2020.tsv.gz (last updated March 27th 2020).
Human Protein Atlas normal tissue and cancer tissue data was acquired from the website: https://www.proteinatlas.org/about/download (last visited March 28th 2020)
Harvard Dataverse: HPAStainR – A Bioconductor and shiny app to query protein expression patterns in the Human Protein Atlas, https://doi.org/10.7910/DVN/CL5ZTA7.
This project contains the following extended data:
Extended Table 1. The number of proteins evaluated and positively stained for each cell type. For each tissue cell combination the number of proteins being positively scored over the number of times proteins are evaluated. These are categorically grouped on the amount of proteins evaluated.
Extended Table 2. The rarity for proteins in normal tissue across different filters. For each gene in normal tissue that was detected, the percent of how often proteins stained compared to how often they were histologically scored based on three quality filters, low, normal and high. Each protein is also labeled if it is considered rare or not in a given tissue based on if its percentage was in the bottom 1st quartile of the distribution for each quality filter. NA indicates that the protein never reached the threshold to be counted in a given filter level. Proteins that never positively stained were not included.
Extended Table 3. The rarity of proteins in cancer samples. The percent positive staining of 15,301 in cancer cells. The quartile of proteins with the lowest values were indicated as rare. Note, there is no quality filter for cancer thus different cancer samples from the same type of cancer can have different staining patterns.
Extended Table 4. The extended HPAStainR output from Table 1.
Extended Table 5. HPAStainR output of cluster A from McCall et al. The full results of HPAStainR when running cluster A of McCall et al. through the package. Pneumocytes were expected and observed.
Extended Table 6. HPAStainR output of cluster B from McCall et al. The full results of HPAStainR when running cluster B of McCall et al. through the package. Bronchial epithelial cells were expected and observed.
Data are available under the terms of the Creative Commons Zero "No rights reserved" data waiver (CC0 1.0 Public domain dedication).
Software available from: https://32tim32.shinyapps.io/HPAStainR/
Bioconductor package available from: https://doi.org/doi:10.18129/B9.bioc.HPAStainR
Source code available from: https://github.com/tnieuwe/HPAStainR
Archived source code as at time of publication: https://doi.org/10.5281/zenodo.404871412.
Software license: Artistic-2.0
Analysis code available from: https://github.com/tnieuwe/HPAstainR_dev_paper
Archived analysis code as at time of publication: https://doi.org/10.5281/zenodo.404870413.
License: Artistic-2.0
We thank Matthew N. McCall, Zachary P. Brehm, Stephanie Y. Yang, and Veronica F. Busa for their consultation on the creation of the software.
| Views | Downloads | |
|---|---|---|
| F1000Research | - | - |
|
PubMed Central
Data from PMC are received and updated monthly.
|
- | - |
Is the rationale for developing the new software tool clearly explained?
Yes
Is the description of the software tool technically sound?
Partly
Are sufficient details of the code, methods and analysis (if applicable) provided to allow replication of the software development and its use by others?
Yes
Is sufficient information provided to allow interpretation of the expected output datasets and any results generated using the tool?
Yes
Are the conclusions about the tool and its performance adequately supported by the findings presented in the article?
Yes
Competing Interests: No competing interests were disclosed.
Reviewer Expertise: Bioinformatics particularly in RNA-seq, single-cell genomics, and algorithm dev. areas.
Is the rationale for developing the new software tool clearly explained?
Yes
Is the description of the software tool technically sound?
Partly
Are sufficient details of the code, methods and analysis (if applicable) provided to allow replication of the software development and its use by others?
Yes
Is sufficient information provided to allow interpretation of the expected output datasets and any results generated using the tool?
Partly
Are the conclusions about the tool and its performance adequately supported by the findings presented in the article?
Yes
Competing Interests: No competing interests were disclosed.
Reviewer Expertise: Computational biology, proteomics, genomics, research software development, open and reproducible research.
Is the rationale for developing the new software tool clearly explained?
Yes
Is the description of the software tool technically sound?
Yes
Are sufficient details of the code, methods and analysis (if applicable) provided to allow replication of the software development and its use by others?
Yes
Is sufficient information provided to allow interpretation of the expected output datasets and any results generated using the tool?
Yes
Are the conclusions about the tool and its performance adequately supported by the findings presented in the article?
Yes
Competing Interests: No competing interests were disclosed.
Reviewer Expertise: Genetics and Genomics, Bioinfomatics, Cell biology.
Alongside their report, reviewers assign a status to the article:
| Invited Reviewers | |||
|---|---|---|---|
| 1 | 2 | 3 | |
|
Version 2 (revision) 22 Mar 21 |
read | read | read |
|
Version 1 08 Oct 20 |
read | read | read |
Provide sufficient details of any financial or non-financial competing interests to enable users to assess whether your comments might lead a reasonable person to question your impartiality. Consider the following examples, but note that this is not an exhaustive list:
Sign up for content alerts and receive a weekly or monthly email with all newly published articles
Already registered? Sign in
The email address should be the one you originally registered with F1000.
You registered with F1000 via Google, so we cannot reset your password.
To sign in, please click here.
If you still need help with your Google account password, please click here.
You registered with F1000 via Facebook, so we cannot reset your password.
To sign in, please click here.
If you still need help with your Facebook account password, please click here.
If your email address is registered with us, we will email you instructions to reset your password.
If you think you should have received this email but it has not arrived, please check your spam filters and/or contact for further assistance.
Comments on this article Comments (0)