Keywords
Genome analysis, interval set, similarity metric, sequence comparison, algorithm
This article is included in the Bioinformatics gateway.
This article is included in the Cell & Molecular Biology gateway.
Genome analysis, interval set, similarity metric, sequence comparison, algorithm
A few minor changes are made to the text according to the suggestions of the reviewers. The title word 'self-consistent' is replaced with 'novel'. A small subset of the test data and instructions are added to the software page to ease the verification of the main result.
See the authors' detailed response to the review by Zhaohui Steve Qin
See the authors' detailed response to the review by Burcak Otlu
Functional genomic data are often summarized as interval sets and deposited in public repositories (e.g., UCSC, ENCODE, Roadmap, GEO, SRA etc.). Identifying relationships among sequences and searching through widely available sequence data are routine tasks in genomic research. A fundamental operation in genomic/epigenomic analysis is comparing two interval sets, and many algorithms and tools have been developed for this purpose (Alekseyenko & Lee, 2007; Cormen et al., 2001; Feng et al., 2019; Giardine et al., 2005; Jalili et al., 2019; Kent et al., 2002; Li, 2011; Neph et al., 2012; Quinlan & Hall, 2010; Richardson, 2006). These methods are based on computing the total number of intersections (overlaps) between the two interval sets. To compare a query interval set with multiple interval sets in a genomic sequence database, searching tools LOLA (Sheffield & Bock, 2016) and GIGGLE (Layer et al., 2018) calculate two values — Fisher’s exact p-value and the odds-ratio based on the total number of intersections — and use them as the similarity score to rank the search results. These similarity metrics have proven useful for determining relationships among interval sets, but also have some flaws. First, calculating the Fisher’s exact test results requires building a contingency table, but determining its values is not straightforward. The p-value and odds-ratio for two intervals sets (with number of intervals N1 and N2) are calculated from four numbers, namely, the number of intersections between the two sets, n, the number of intervals in set 1 that do not overlap an interval in set 2, N1 - n, the number of intervals in set 2 that do not overlap an interval in set 1, N2 - n, and the number of intervals that are not present in either set, m. Determining the value of the fourth number m is not straightforward; in LOLA, it depends on the definition of a “universe set” that is not objectively defined, whereas GIGGLE estimates m from the two interval sets. Second, the total number of overlaps n does not necessarily reflect similarity since intervals can have very different lengths (often in the range of 1 to 105 base pairs) and two very different intervals may intersect by only a few base pairs. This can result in inconsistency of the metrics: a comparison between two identical interval sets may have a larger p-value or smaller odds-ratio than a comparison between two different interval sets (see example cases and analysis in the next section). More strikingly, since one interval may contain or cover other intervals in an interval set, depending on how the overlaps are computed, n can be larger than N1 and/or N2, i.e., N1-n and/or N2-n can be negative, which leads to both the p-value and odds-ratio being undefined—another potential source of inconsistency. Third, the Fisher’s exact-based metrics require two values (p-value and odds-ratio) but neither is a direct measurement of the similarity: p-values are sensitive to the total number of regions and can range as low as 10-200 for large genomic interval sets, and odds-ratios are sensitive to small numbers; and neither metric directly informs on how similar the two sets are. Last, the p-value calculation is computationally expensive for genomic interval sets, particularly when the number of intervals is large (up to 109). To overcome these weaknesses of the Fisher’s exact-based metrics, we developed Seqpare, a self-consistent metric for quantifying the similarity among genomic interval sets.
The Seqpare metric uses a single index to quantify the degree of similarity S of two interval sets with number of intervals N1 and N2. Similar to the Jaccard index, the Seqpare metric is directly defined as the ratio of the total effective overlap O of the two interval sets over the union N1+N2 - O:
For two intervals v1 in set 1 and v2 in set 2, the similarity s is defined as:
where o is the length of the intersection and l1 and l2 are the lengths of v1 and v2 respectively. Definition 2 is the Jaccard index for individual intervals: o represents the effective overlap of the two intervals and s takes values in the range of [0, 1]: s = 0 indicates that there is no overlap between the two intervals, and s = 1 means that the union equals the overlap so v1 and v2 are identical. Then the total effective overlap O for the two interval sets can be calculated by adding up the similarities of all mutual best matching (MBM) pairs:
A MBM pair is defined as a pair of intervals v1 and v2 that fulfill the following conditions: among all intervals in set 2 that intersect v1, v2 matches v1 the best, i.e., the similarity s between v1 and v2 is the highest among those intersections; and among all intervals in set 1 that intersect v2, v1 matches v2 the best. Clearly, if two intervals only intersect each other, then they form an MBM pair. In Figure 1a, the two long intervals (the 1st in set 1 and the 1st in set 2) only intersect each other (intersection pair ip1,1), so they form an MBM pair; similarly, the two short intervals ip2,2 form another MBM pair. For intervals that involve multiple intersections, we define a relatively simple and strict rule to find the MBM pairs: find and choose the first MBM pair that has the highest s among all involved intersection pairs, then find and choose the next MBM pair that has the highest s from the rest of the intersection pairs (excluding all pairs that involve the intervals that are already chosen), and so on until there are no more intersection pairs. In Figure 1b, there are 3 intersection pairs: ip1,2 with s=1/5, ip1,3 with s=1/9, and ip2,3 with s=1/5. So the first MBM pair is either ip1,2 or ip2,3 depending on which one is found first. If ip1,2 is chosen as the first MBM pair, then ip1,3 will not be considered since interval 1 in set 1 is already chosen, and then we have only ip2,3 left, which is the second MBM pair. We get the same result if ip2,3 is chosen as the first MBM pair. In Figure 1d, there are 6 intersection pairs and two MBM pairs: ip1,1 and ip3,2 both with s=1, where interval 2 in set 1 (i2,1) does not have a match. Note that interval i2,1 matches best with interval i1,2, but i1,2 does not match best with i2,1, so they are not the mutual best matching pair.
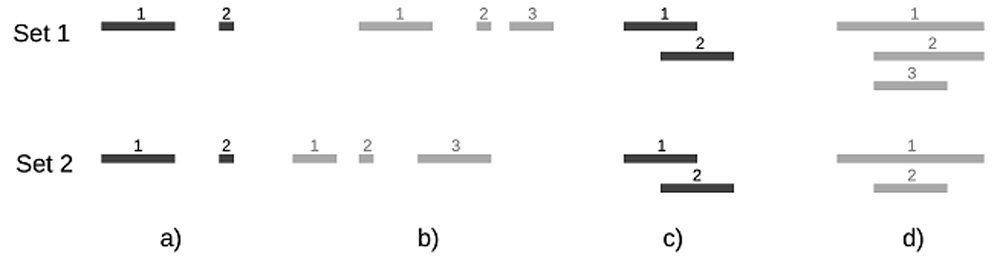
The length ratio of the short interval to the longer intervals are 1: 5 in a), 1: 3: 5 in b), and 2: 3 :4 in d). The total number of overlaps n is 2 for a), 3 for b) (interval 1 in Set 1 intersects two intervals in Set 2), 4 for c) and 6 for d). The p-value in case b is smaller than that in case a. N1 - n and N2 - n are both negative in cases c and d.
Since the number of total matching pairs ≤ Min(N1, N2) — the minimum of N1 and N2 — and s is in range of [0, 1], we obtain O ≤ Min(N1, N2), and S takes a value in the range of [0, 1]. If S is zero, then there is no matching pair, and vice versa; if S = 1, then N1 = N2 = O (the two sets are equivalent), and vice versa. And, because each s is the mutual best match, O is symmetric (the amount of overlap between set 1 and set 2 is the same as that between set 2 to set 1) and so is S.
In Figure 1a, Oa=2 and Sa=1, which is correct because the two sets are identical. In Figure 1b, Ob=2/5 and Sb=1/14, which is expected since the two sets are very different. The Fisher’s exact approach is inconsistent here: the p-value in 1b is smaller than that in 1a although the two sets in 1b are very different while those in 1a are equivalent. Assuming that the number of intervals N in the ‘universe set’ is 100, then Fisher’s exact test contingency table is [(2, 0), (0, 98)] in 1a and [(3, 0), (0, 97)] in 1b, which gives pa = 2.02×10⁻⁴ and pb = 6.18×10⁻⁶ respectively. The odds-ratio is ∞ in both cases. In Figure 1c and Figure 1d, N1- n and N2 - n are all negative, so it is not conceptually appropriate to use Fisher’s exact test to calculate the p-value and odds-ratio.
The implementation of the Seqpare metric is simple. The searching for MBM pairs is deterministic and it can be implemented by directly following the description in the above section. The Seqpare code is built on top of the AIList v0.0.1 (Feng et al., 2019) software written in C.
The Seqpare software (Feng & Feng, 2020) was tested on Linux machines and the minimum required memory is 8GB. The interval set file should be in the format of bed or bed.gz.
To test Seqpare and compare it with the Fisher’s exact-based metrics, we took 100 interval sets from a UCSC database and used one interval set, affyGnf1h, as a query to search over the database. Because the database contains the query set, affyGnf1h should have the highest similarity score. Table 1 (Feng & Feng, 2020) shows part of the result. Interval set affyGnf1h indeed ranks first with maximum similarity 1 when using Seqpare, but it ranks 94th out of 100 when using the p-value and ranks last when using the odds-ratio. This happens because N1-n and N2-n are both negative (n=16686, N1=N2=12158). Given this inconsistency, GIGGLE sets negative N1-n and N2-n to zero to calculate the p-value, and to one to calculate the odds-ratio. The Seqpare indices for other interval sets are all small (<0.03) because the average effective overlap of an intersection pair in those sets is about 0.1 or less, i.e., they are very different from the query set affyGnf1h; however, all of the p-values are so small (e-200), which suggests that the p-value is not a meaningful similarity index for these genomic interval sets. This search takes 6m30s for Seqpare and 15m32s for GIGGLE. All computations were carried out on a computer with a 2.8GHz CPU, 16GB memory, and an external SSD hard disk. The complete results can be found at the same site as the software.
We have shown that the Fisher’s exact test approach may be not the most appropriate test statistic for comparing similarity among interval sets. While the approach has been shown to be successful for many questions, we have demonstrated how it can break down for a variety of reasons, such as very similar interval sets, within-set containment, widely varying interval lengths among sets, or small effective overlaps. In contrast, Seqpare is a self-consistent metric for quantifying the similarity of two interval sets that addresses these concerns. Seqpare is the first rigorously defined metric for comparing two sequences based on their interval sets. In addition to the metric itself, our Seqpare software tool provides functions for both searching and mapping large-scale interval datasets. We anticipate that this approach will contribute to novel results for interval set searching.
Test data of interval sets are from http://hgdownload.cse.ucsc.edu/goldenPath/hg19/database
A small subset of the test data and instructions are provided for verifying the result: https://github.com/deepstanding/seqpare/ucsc_30
Zenodo: deepstanding/seqpare: First release of Seqpare. http://doi.org/10.5281/zenodo.3840051 (Feng & Feng, 2020)
This project contains the following underlying data:
- AffyGnf1h_ucsc100_seqpare (Seqpare similarity result)
- AffyGnf1h_ucsc100_giggle (GIGGLE p-value and odds-ratio result)
Data is available alongside the source code under the terms of the MIT license.
Source code available from: https://github.com/deepstanding/seqpare
Archived source code at time of publication: http://doi.org/10.5281/zenodo.3840051 (Feng & Feng, 2020)
License: MIT
| Views | Downloads | |
|---|---|---|
| F1000Research | - | - |
|
PubMed Central
Data from PMC are received and updated monthly.
|
- | - |
Provide sufficient details of any financial or non-financial competing interests to enable users to assess whether your comments might lead a reasonable person to question your impartiality. Consider the following examples, but note that this is not an exhaustive list:
Sign up for content alerts and receive a weekly or monthly email with all newly published articles
Already registered? Sign in
The email address should be the one you originally registered with F1000.
You registered with F1000 via Google, so we cannot reset your password.
To sign in, please click here.
If you still need help with your Google account password, please click here.
You registered with F1000 via Facebook, so we cannot reset your password.
To sign in, please click here.
If you still need help with your Facebook account password, please click here.
If your email address is registered with us, we will email you instructions to reset your password.
If you think you should have received this email but it has not arrived, please check your spam filters and/or contact for further assistance.
Comments on this article Comments (0)